In this chapter, we will share with you some of the top low-code development tools repos (LCDT repos) on GitHub in 2021 measured by different metrics including the number of stars, PRs, contributors, countries, regions and so on.
Deep Insight Into Open Source Databases
On this page, we will share with you many deep insights into open source databases, such as the database popularity, database contributors, coding vitality, community feedback and so on.
We’ll also share the SQL commands that generate all these analytical results above each chart, so you can use them on your own on TiDB Cloud following this 10-minute tutorial.
Deep Insights into Programming Languages
In this chapter, we will share with you some of the top programming language repos (PL repos) on GitHub in 2021 measured by different metrics including the number of stars, PRs, contributors, countries, regions and so on.
Deep Insights into Web Frameworks
In this chapter, we will share with you some of the top Web Framework repos (WF repos) on GitHub in 2021 measured by different metrics including the number of stars, PRs, contributors, countries, regions and so on.
Explore Deep in 4.6 Billion GitHub Events
4.6 billion is literally an astronomical figure. The richest star map of our galaxy, brought by Gaia space observatory, includes just under 2 billion stars. What does a view of 4.6 billion GitHub events really look like? What secrets and values can be discovered in such an enormous amount of data?
Here you go: OSSInsight.io can help you find the answer. It’s a useful insight tool that can give you the most updated open source intelligence, and help you deeply understand any single GitHub project or quickly compare any two projects by digging deep into 4.6 billion GitHub events in real time. Here are some ways you can play with it.
Compare any two GitHub projects
Do you wonder how different projects have performed and developed over time? Which project is worthy of more attention? OSSInsight.io can answer your questions via the Compare Projects page.
Let’s take the Kubernetes repository (K8s) and Docker’s Moby repository as examples and compare them in terms of popularity and coding vitality.
Popularity
To compare the popularity of two repositories, we use multiple metrics including the number of stars, the growth trend of stars over time, and stargazers’ geographic and employment distribution.
Number of stars
The line chart below shows the accumulated number of stars of K8s and Moby each year. According to the chart, Moby was ahead of K8s until late 2019. The star growth of Moby slowed after 2017 while K8s has kept a steady growth pace.
Geographical distribution of stargazers
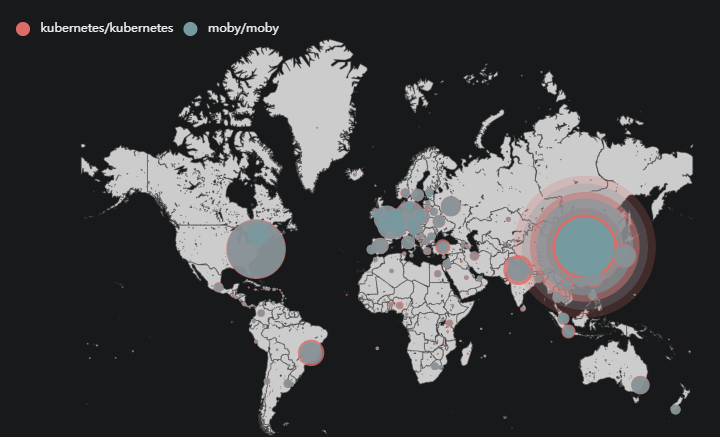
The map below shows the stargazers’ geographical distribution of Moby and K8s. As you can see, their stargazers are scattered around the world with the majority coming from the US, Europe, and China.

Employment distribution of stargazers
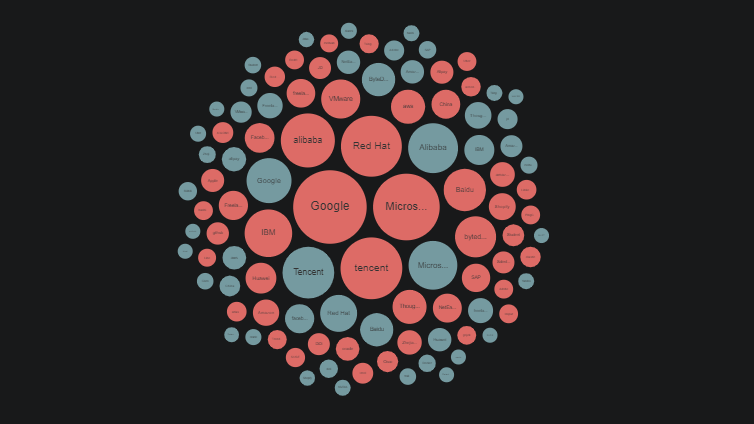
The chart below shows the stargazers’ employment of K8s (red) and Moby (dark blue). Both of their stargazers work in a wide range of industries, and most come from leading dotcom companies such as Google, Tencent, and Microsoft. The difference is that the top two companies of K8s’ stargazers are Google and Microsoft from the US, while Moby’s top two followers are Tencent and Alibaba from China.

SaaS Insight for Building a Real-time CRM Application
Providing insights on large volume of email data might not be as easy as we thought. While data coming in real-time, indices and metadata are to be built consistently. To make things worse, the data volume is beyond traditional single node databases' reach.
Background
To store large volumes of real-time user data like email and provide insights is not easy. If your application is layered on top of Gmail to automatically extract and organize the useful information buried inside of our inboxes.
It became clear that they were going to need a better system for organizing terabytes of email metadata to power collaboration as their customer base rapidly increased, it is not easy to provide insights. You need to organize email data by first applying a unique identifier to the emails and then proactively indexing the email metadata. The unique identifier is what connects the same email headers across. For each email inserted in real-time, the system extracts meta information from it and builds indices for high concurrent access. When data volume is small, it's all good: traditional databases provide all you need. However, when data size grows beyond a single node's capacity, everything becomes very hard.
Potential Database Solutions
Regarding databases, there are some options you might consider:
- NoSQL database. While fairly scalable, it does not provide you indexing and comprehensive query abilities. You might end up implementing them in your application code.
- Sharing cluster of databases. Designing sharding key and paying attention to the limitations between shards are painful. It might be fine for applications with simple schema designs, but it will be too complicated for CRM. Moreover, it's very hard to maintain.
- Analytical databases. They are fine for dashboard and reporting. But not fine for high concurrent updates and index based serving.
How to get real-time insights
TiDB is a distributed database with user experience of traditional databases. It looks like a super large MySQL without the limitations of NoSQL and sharding cluster solutions. With TiDB, you can simply have the base information, indices and metadata being updated in a concurrent manner with the help of cross-node transaction ability.
To build such a system, you just need following steps:
- Create schemas according to your access pattern with indices on user name, organization, job title etc.
- Use streaming system to gather and extract meta information from your base data
- Insert into TiDB via ordinary MySQL client driver like JDBC. You might want to gather data in small batches of hundreds of rows to speed up ingestion. In a single transaction, updates on base data, indices and meta information are guaranteed to be consistent.
- Optionally, deploy a couple of TiFlash nodes to speed up large scale reporting queries.
- Access the data just like in MySQL and you are all done. SQL features for analytics like aggregations, multi-joins or window functions are all supported with great performance.
For more cases, please see here.
🌟 Details in how OSS Insight works
Go to read Use TiDB Cloud to Analyze GitHub Events in 10 Minutes and use the Serverless Tier TiDB Cloud Cluster.
You can find how we deal with massive github data in Data Preparation for Analytics as well!
[Outdated] Use TiDB Cloud to Analyze GitHub Events in 10 Minutes
TiDB is an open source distributed NewSQL database with horizontal scalability, high availability, and strong consistency. It can also deal with mixed OLTP and OLAP workloads at the same time by leveraging its hybrid transactional and analytical (HTAP) capability.
TiDB Cloud is a fully-managed Database-as-a-Service (DBaaS) that brings everything great about TiDB to your cloud and lets you focus on your applications, not the complexities of your database.
In this tutorial, we will provide you with a piece of sample data of all GitHub events occurring on January 1, 2022, and walk you through on how to use TiDB Cloud to analyze this data in 10 minutes.
Sign up for a TiDB Cloud account (Free)
Data Preparation for Analytics
Data
All the data we use here on this website sources from GH Archive, a non-profit project that records and archives all GitHub events data since 2011. The total data volume archived by GH Archive can be up to 4 billion rows. We download the json file on GH Archive and convert it into csv format via Script, and finally load it into the TiDB cluster in parallel through TiDB-Lightning.
In this section, we will explain step by step how we conduct this process.
- Prepare the data in csv format for TiDB Lighting.


