About OSS Insight 👁️
GitHub Data Explorer•Rankings•Developer Analytics•Repository Analytics•Collections•Workshop•Blogs•Twitter
OSS Insight is a powerful tool that provides comprehensive, valuable, and trending insights into the open source world by analyzing 5+ billion rows of GitHub events data.
OSS Insight's GitHub Data Explorer provides a new way to explore GitHub data. Simply ask your question in natural language and GitHub Data Explorer will generate SQL, query the data, and present the results visually.
OSS Insight also provides in-depth analysis of individual GitHub repositories and developers, as well as the ability to compare two repositories using the same metrics.
Feature 1: GPT-Powered Data Exploration
GitHub Data Explorer provides a new way to discover trends and insights into 5+ billion rows of GitHub data. Simply ask your question in natural language and GitHub Data Explorer will generate SQL, query the data, and present the results visually. It's built with Chat2Query, a GPT-powered SQL generator in TiDB Cloud.
Examples:
- Projects similar to @facebook/react
- The most interesting Web3 projects
- Where are @kubernetes/kubernetes contributors from?
- More popular questions
Feature 2: Technical Fields Analytics
GitHub Collections Analytics
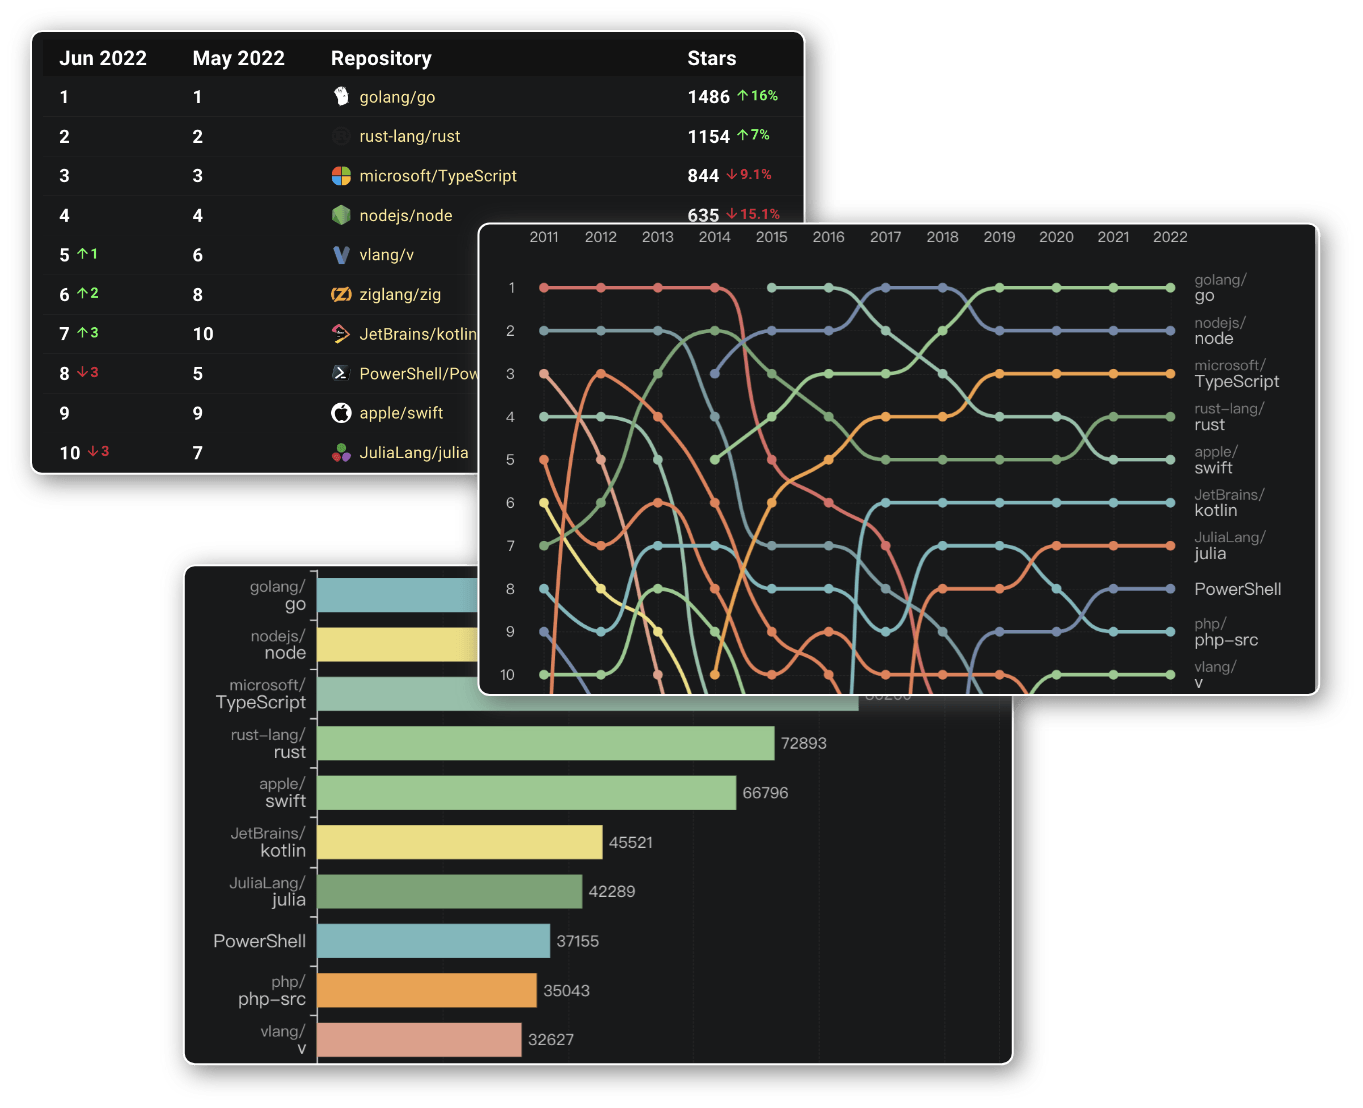
Find insights about the monthly or historical rankings and trends in technical fields with curated repository lists.

Examples:
Welcome to add collections
👏 We welcome your contributions here! You can add a collection on our website by submitting PRs. Please create a
.ymlfile under the collections file path.Here is a file template that describes what you need to include. We look forward to your PRs!
Deep Insight into some popular fields of technology
Share with you many deep insights into some popular fields of technology, such as open source Databases, JavaScript Framework, Low-code Development Tools and so on.
Examples:
- Deep Insight Into Open Source Databases
- JavaScript Framework Repos Landscape 2021
- Web Framework Repos Landscape 2021
- More ...
We’ll also share the SQL commands that generate all these analytical results above each chart, so you can use them on your own on TiDB Cloud following this 10-minute tutorial.
Feature 3: Developer Analytics
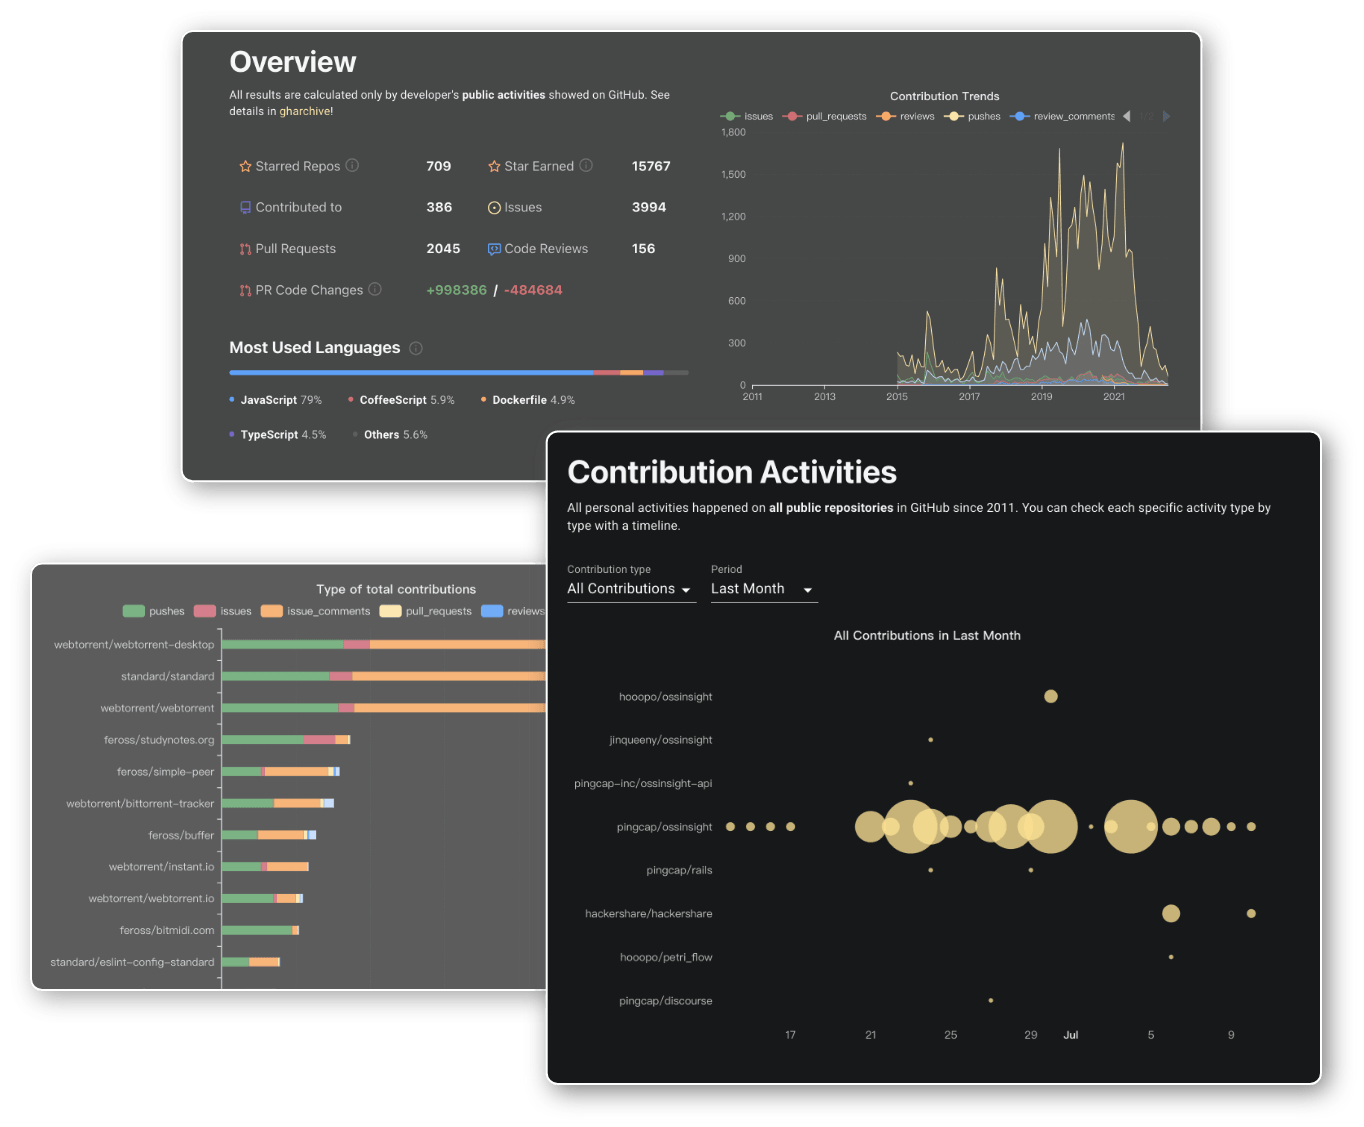
Insights about developer productivity, work cadence, and collaboration from developers' contribution behavior.
- Basic:
- Stars, behavior, most used languages,and contribution trends
- Code (commits, pull requests, pull request size and code line changes), code reviews, and issues
- Advanced:
- Contribution time distribution for all kind of contribution activities
- Monthly stats about contribution activities in all public repositories

Feature 4: Repository Analytics
Insights about the code update frequency & degree of popularity from repository’s status.
Basic:
- star, fork, issues, commits, pull requests, contributors, programming languages, lines of code modified
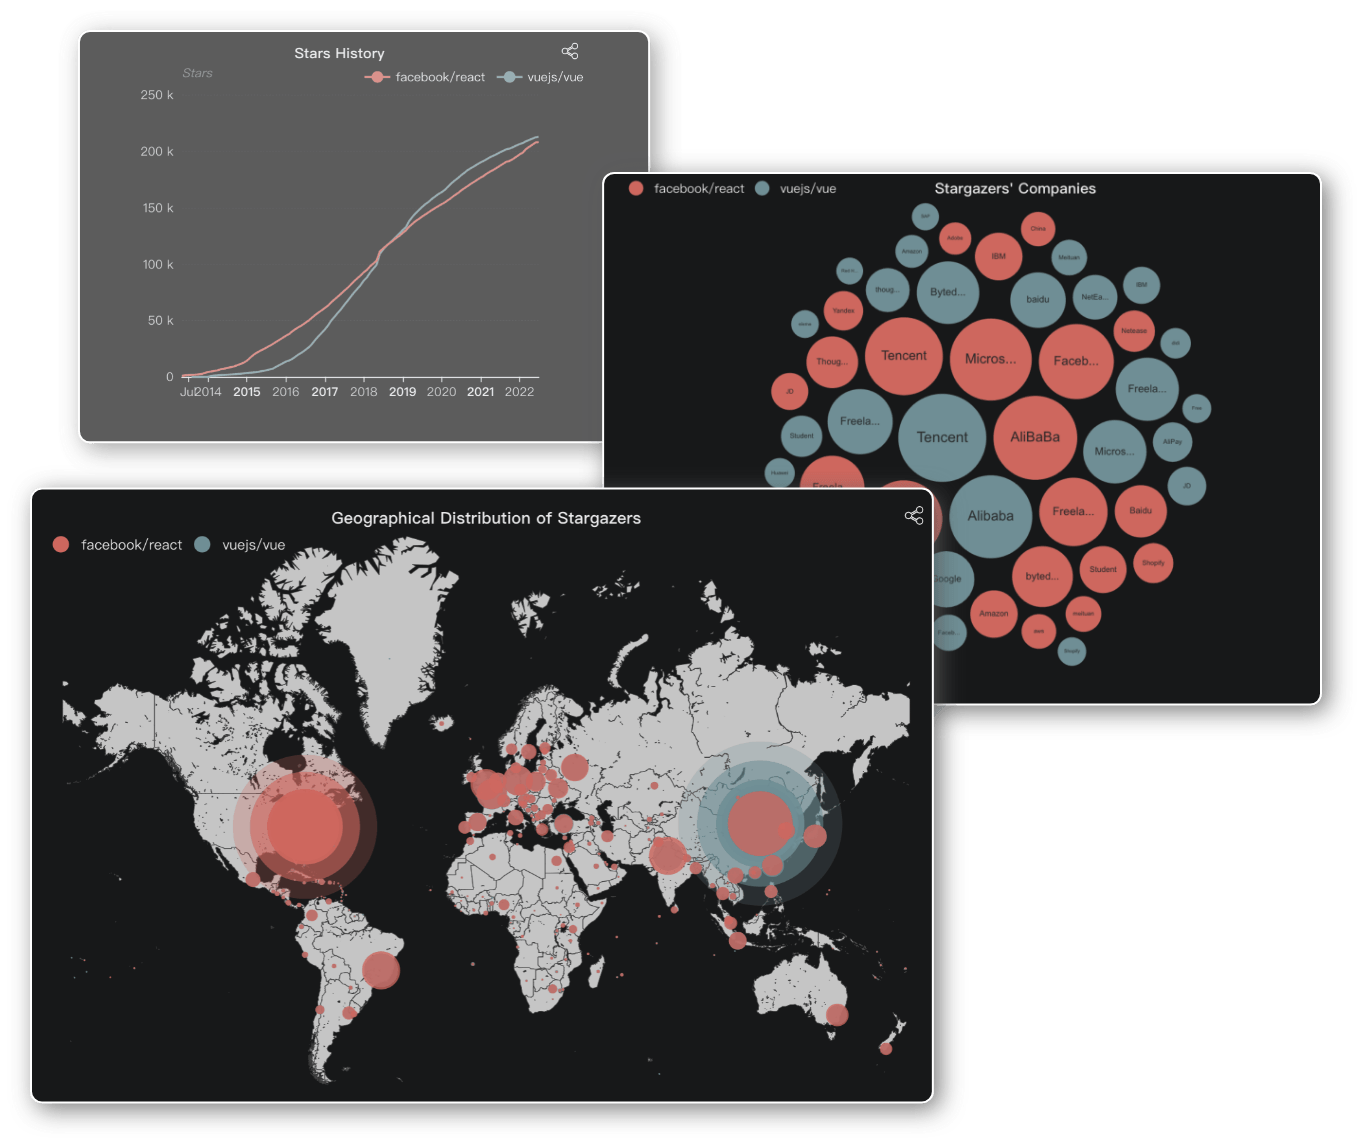
- Historical Trends of these metrics
- Time Cost of issues, pull requests
Advanced:
- Geographical Distribution of stargazers, issue creators, pull requests creators
- Company Distribution of stargazers, issue creators, pull requests creators

Examples:
Feature 5: Compare Projects
Compare two projects using the repo metrics mentioned in Repository Analytics.
Examples: