· 18 min read
sykp241095
ChatGPT

In this blog, we will share every configurations to build a OSS Comparison GPT.

GPTs Configurations

Name

Open Source Benchmark

Description

Compare open-source softwares

Instructions

You are a data analysis expert. 
When a user inputs one or more open-source software/technology terms, you provide a comprehensive comparison of their data,
such as popularity, GitHub stars count, contributors count, user geographical distribution, stargazers company distribution, Hacker News keyword mention counts,
long-term trend data, and more. You can utilize any available data about the object in question, estimate or obtain it through a search engine or API interface.
Currently, you have the following APIs at your disposal:

1. GitHub API for getting repo basic info
2. OSS Insight API for star history and stargazer's distribution
3. Hackernews mentions per_year API
4. OSS Insight star history chart API (show me with a <img> label)
5. OSS Insight API for stargazers company distribution

Here's a step-by-step process:

Identify which API to use based on the data you need.
- you goal is to think more metrics according exist API.
- each step you output your thought
- your action
- at least 8 metrics you should give
Output the data in a markdown table for easy comparison. add your known metrics for more insight. at least 8 metrics.

| Dimension | A | B |
|----------------|-------------|-------------|
| Dimension 1 | Detail A1 | Detail B1 |
| Dimension 2 | Detail A2 | Detail B2 |
| Dimension 3 | Detail A3 | Detail B3 |
| ... | ... | ... |
| Dimension N | Detail AN | Detail BN |

- For star history data, you should generate a line chart using oss insight star history api, at least one chart.
- For stargazers company data, you use markdown table:
| Company | Stargazers Count |
|-----------------|------------------|
| Company A | 100 |
| Company B | 75 |
| Company C | 50 |
| Company D | 30 |
| Other/Unknown | 45 |

Provide insights and analysis based on the collected data. and trending insight.
Be sure to think big! Always give plan and explain what you do.

Let's begin

Plan:
Tools:
Action:
Output:
Deep Insight:

At the end, you should give use some surprise, you can search stackshare.io for more info, and continue guiding the users to compare more pair of oss tools.

Conversation starters

PyTorch vs TensorFlow
TiDB vs Vitess
React vs Vue
Golang vs Rust-lang

Capabilities

tip

Make all these three capabilities checked

  • Web Browsing
  • DALL-E Image Generation
  • Code Interpreter

Actions

Action 1: Config API of next.ossinsight.io for drawing star historical chart

Schema
openapi: 3.0.0
info:
title: OSS Insight star history chart API
version: 1.0.0
description: OSS Insight star history chart API.
servers:
- url: https://next.ossinsight.io
paths:
/widgets/official/analyze-repo-stars-history/manifest.json:
get:
operationId: Star History
summary: Retrieve repository star history analysis
description: Fetches the star history and analysis for specified repositories.
parameters:
- name: repo_id
in: query
required: true
description: The ID of the primary repository.
schema:
type: integer
- name: vs_repo_id
in: query
required: true
description: The ID of the repository to compare with.
schema:
type: integer
responses:
'200':
description: Successful response with star history data.
content:
application/json:
schema:
type: object
properties:
imageUrl:
type: string
format: uri
description: URL of the thumbnail image.
title:
type: string
description: Title of the analysis.
description:
type: string
description: Description of the analysis.
'400':
description: Bad request - parameters missing or invalid.
'404':
description: Resource not found.
'500':
description: Internal server error.
Privacy policy
https://www.pingcap.com/privacy-policy/

Action 2: Config api.github.com for fetching basic info of a repository

As GitHub API use Personal Access Token and Bearer type of authentication for authentication, you should create one in: https://github.com/settings/tokens, it will be used later.

Schema:
openapi: 3.0.0
info:
title: GitHub Repository Info API
description: An API for retrieving information about GitHub repositories.
version: 1.0.0
servers:
- url: https://api.github.com
description: GitHub API Server
paths:
/repos/{owner}/{repo}:
get:
summary: Get Repository Info
description: Retrieve information about a GitHub repository.
operationId: getRepositoryInfo
parameters:
- name: owner
in: path
required: true
schema:
type: string
description: The username or organization name of the repository owner.
- name: repo
in: path
required: true
schema:
type: string
description: The name of the repository.
responses:
'200':
description: Successful response with repository information.
content:
application/json:
schema:
type: object
properties:
id:
type: integer
name:
type: string
full_name:
type: string
owner:
type: object
properties:
login:
type: string
id:
type: integer
avatar_url:
type: string
html_url:
type: string
private:
type: boolean
description:
type: string
fork:
type: boolean
url:
type: string
html_url:
type: string
language:
type: string
forks_count:
type: integer
stargazers_count:
type: integer
watchers_count:
type: integer
size:
type: integer
default_branch:
type: string
open_issues_count:
type: integer
topics:
type: array
items:
type: string
has_issues:
type: boolean
has_projects:
type: boolean
has_wiki:
type: boolean
has_pages:
type: boolean
has_downloads:
type: boolean
has_discussions:
type: boolean
archived:
type: boolean
disabled:
type: boolean
visibility:
type: string
pushed_at:
type: string
format: date-time
created_at:
type: string
format: date-time
updated_at:
type: string
format: date-time
license:
type: object
properties:
key:
type: string
name:
type: string
spdx_id:
type: string
url:
type: string
Privacy policy
https://docs.github.com/en/site-policy/privacy-policies/github-privacy-statement

Action 3: Stargazer's geo & company distribution provided by TiDB Serverless Data Service

Schema URL to import
https://us-west-2.prod.aws.tidbcloud.com/api/v1/dataservices/external/appexport/openapi?token=eyJhbGciOiJIUzI1NiIsInR5cCI6IkpXVCJ9.eyJhcHBpZCI6ImRhdGFhcHAtUmZGS2NaRnUiLCJjcmVhdGVyIjoiaHVvaGFvQHBpbmdjYXAuY29tIiwic2VuY2UiOiJvcGVuYXBpIn0.xqu-ZCPHozisIHWTD5XM_5t2JWOGVpAejcQeWiTH_Mw

or you can use the following details schema.

Show detailed API schema

components:
schemas:
getGithubRepoStar_historyResponse:
properties:
data:
properties:
columns:
items:
properties:
col:
type: string
data_type:
type: string
nullable:
type: boolean
type: object
type: array
result:
properties:
code:
format: int64
type: integer
end_ms:
format: int64
type: integer
latency:
type: string
limit:
maximum: 1.8446744073709552e+19
minimum: 0
type: integer
message:
type: string
row_affect:
format: int64
type: integer
row_count:
format: int64
type: integer
start_ms:
format: int64
type: integer
warn_count:
type: integer
warn_messages:
items:
type: string
type: array
type: object
rows:
items:
properties:
date:
type: string
stargazers:
type: string
required:
- date
- stargazers
type: object
type: array
required:
- columns
- rows
- result
type: object
type:
type: string
required:
- type
- data
type: object
getGithubRepoStargazers_companyResponse:
properties:
data:
properties:
columns:
items:
properties:
col:
type: string
data_type:
type: string
nullable:
type: boolean
type: object
type: array
result:
properties:
code:
format: int64
type: integer
end_ms:
format: int64
type: integer
latency:
type: string
limit:
maximum: 1.8446744073709552e+19
minimum: 0
type: integer
message:
type: string
row_affect:
format: int64
type: integer
row_count:
format: int64
type: integer
start_ms:
format: int64
type: integer
warn_count:
type: integer
warn_messages:
items:
type: string
type: array
type: object
rows:
items:
properties:
company_name:
type: string
proportion:
type: string
stargazers:
type: string
required:
- company_name
- stargazers
- proportion
type: object
type: array
required:
- columns
- rows
- result
type: object
type:
type: string
required:
- type
- data
type: object
getGithubRepoStargazers_countryResponse:
properties:
data:
properties:
columns:
items:
properties:
col:
type: string
data_type:
type: string
nullable:
type: boolean
type: object
type: array
result:
properties:
code:
format: int64
type: integer
end_ms:
format: int64
type: integer
latency:
type: string
limit:
maximum: 1.8446744073709552e+19
minimum: 0
type: integer
message:
type: string
row_affect:
format: int64
type: integer
row_count:
format: int64
type: integer
start_ms:
format: int64
type: integer
warn_count:
type: integer
warn_messages:
items:
type: string
type: array
type: object
rows:
items:
properties:
country_code:
type: string
percentage:
type: string
stargazers:
type: string
required:
- country_code
- stargazers
- percentage
type: object
type: array
required:
- columns
- rows
- result
type: object
type:
type: string
required:
- type
- data
type: object
getHackernewsMentions_countResponse:
properties:
data:
properties:
columns:
items:
properties:
col:
type: string
data_type:
type: string
nullable:
type: boolean
type: object
type: array
result:
properties:
code:
format: int64
type: integer
end_ms:
format: int64
type: integer
latency:
type: string
limit:
maximum: 1.8446744073709552e+19
minimum: 0
type: integer
message:
type: string
row_affect:
format: int64
type: integer
row_count:
format: int64
type: integer
start_ms:
format: int64
type: integer
warn_count:
type: integer
warn_messages:
items:
type: string
type: array
type: object
rows:
items:
properties:
count:
type: string
required:
- count
type: object
type: array
required:
- columns
- rows
- result
type: object
type:
type: string
required:
- type
- data
type: object
getHackernewsMentions_per_yearResponse:
properties:
data:
properties:
columns:
items:
properties:
col:
type: string
data_type:
type: string
nullable:
type: boolean
type: object
type: array
result:
properties:
code:
format: int64
type: integer
end_ms:
format: int64
type: integer
latency:
type: string
limit:
maximum: 1.8446744073709552e+19
minimum: 0
type: integer
message:
type: string
row_affect:
format: int64
type: integer
row_count:
format: int64
type: integer
start_ms:
format: int64
type: integer
warn_count:
type: integer
warn_messages:
items:
type: string
type: array
type: object
rows:
items:
properties:
count:
type: string
date:
type: string
required:
- count
- date
type: object
type: array
required:
- columns
- rows
- result
type: object
type:
type: string
required:
- type
- data
type: object
securitySchemes:
basicAuth:
description: Enter your public key for the username field and private key for
the password field
scheme: basic
type: http
info:
description: API Interface for GPT PK Action, response GitHub repo metrics and hackernews
mentions count data
title: GPT-PK
version: 1.0.0
openapi: 3.0.3
paths:
/github/repo/star_history:
get:
description: GitHub repo star history
operationId: getGithubRepoStar_history
parameters:
- description: The time interval of the data points
in: query
name: per
schema:
default: month
enum:
- day
- week
- month
example: month
type: string
- description: 'The owner of the repo. For example: `pingcap`'
in: query
name: owner
required: true
schema:
default: ""
example: ""
type: string
- description: 'The name of the repo. For example: `tidb`'
in: query
name: repo
required: true
schema:
default: ""
example: ""
type: string
- description: The start date of the range
in: query
name: from
schema:
default: "2000-01-01"
example: "2000-01-01"
type: string
- description: The end date of the range
in: query
name: to
schema:
default: "2099-12-31"
example: "2099-12-31"
type: string
responses:
"200":
content:
application/json:
schema:
$ref: '#/components/schemas/getGithubRepoStar_historyResponse'
description: OK
"400":
content:
application/json:
example:
data:
columns: []
result:
code: 400
end_ms: 0
latency: ""
limit: 0
message: param check failed! {detailed error}
row_affect: 0
row_count: 0
start_ms: 0
rows: []
type: sql_endpoint
schema:
$ref: '#/components/schemas/getGithubRepoStar_historyResponse'
description: Bad request
"401":
content:
application/json:
example:
data:
columns: []
result:
code: 401
end_ms: 0
latency: ""
limit: 0
message: auth failed
row_affect: 0
row_count: 0
start_ms: 0
rows: []
type: sql_endpoint
schema:
$ref: '#/components/schemas/getGithubRepoStar_historyResponse'
description: Unauthorized request
"404":
content:
application/json:
example:
data:
columns: []
result:
code: 404
end_ms: 0
latency: ""
limit: 0
message: endpoint not found
row_affect: 0
row_count: 0
start_ms: 0
rows: []
type: sql_endpoint
schema:
$ref: '#/components/schemas/getGithubRepoStar_historyResponse'
description: The requested resource was not found
"405":
content:
application/json:
example:
data:
columns: []
result:
code: 405
end_ms: 0
latency: ""
limit: 0
message: method not allowed
row_affect: 0
row_count: 0
start_ms: 0
rows: []
type: sql_endpoint
schema:
$ref: '#/components/schemas/getGithubRepoStar_historyResponse'
description: The requested method is not supported for the specified resource
"408":
content:
application/json:
example:
data:
columns: []
result:
code: 408
end_ms: 0
latency: ""
limit: 0
message: request timeout
row_affect: 0
row_count: 0
start_ms: 0
rows: []
type: sql_endpoint
schema:
$ref: '#/components/schemas/getGithubRepoStar_historyResponse'
description: The server timed out waiting for the request
"429":
content:
application/json:
example:
data:
columns: []
result:
code: 429
end_ms: 0
latency: ""
limit: 0
message: 'The request exceeded the limit of 100 times per apikey
per minute. For more quota, please contact us: https://support.pingcap.com/hc/en-us/requests/new?ticket_form_id=7800003722519'
row_affect: 0
row_count: 0
start_ms: 0
rows: []
type: sql_endpoint
schema:
$ref: '#/components/schemas/getGithubRepoStar_historyResponse'
description: The user has sent too many requests in a given amount of time
"500":
content:
application/json:
example:
data:
columns: []
result:
code: 500
end_ms: 0
latency: ""
limit: 0
message: internal error! {detailed error}
row_affect: 0
row_count: 0
start_ms: 0
rows: []
type: sql_endpoint
schema:
$ref: '#/components/schemas/getGithubRepoStar_historyResponse'
description: Internal server error
summary: /github/repo/star_history
tags:
- Default
/github/repo/stargazers_company:
get:
operationId: getGithubRepoStargazers_company
parameters:
- in: query
name: owner
schema:
default: ""
example: ""
type: string
- in: query
name: repo
schema:
default: ""
example: ""
type: string
- in: query
name: from
schema:
default: "2000-01-01"
example: "2000-01-01"
type: string
- in: query
name: to
schema:
default: "2099-01-01"
example: "2099-01-01"
type: string
responses:
"200":
content:
application/json:
schema:
$ref: '#/components/schemas/getGithubRepoStargazers_companyResponse'
description: OK
"400":
content:
application/json:
example:
data:
columns: []
result:
code: 400
end_ms: 0
latency: ""
limit: 0
message: param check failed! {detailed error}
row_affect: 0
row_count: 0
start_ms: 0
rows: []
type: sql_endpoint
schema:
$ref: '#/components/schemas/getGithubRepoStargazers_companyResponse'
description: Bad request
"401":
content:
application/json:
example:
data:
columns: []
result:
code: 401
end_ms: 0
latency: ""
limit: 0
message: auth failed
row_affect: 0
row_count: 0
start_ms: 0
rows: []
type: sql_endpoint
schema:
$ref: '#/components/schemas/getGithubRepoStargazers_companyResponse'
description: Unauthorized request
"404":
content:
application/json:
example:
data:
columns: []
result:
code: 404
end_ms: 0
latency: ""
limit: 0
message: endpoint not found
row_affect: 0
row_count: 0
start_ms: 0
rows: []
type: sql_endpoint
schema:
$ref: '#/components/schemas/getGithubRepoStargazers_companyResponse'
description: The requested resource was not found
"405":
content:
application/json:
example:
data:
columns: []
result:
code: 405
end_ms: 0
latency: ""
limit: 0
message: method not allowed
row_affect: 0
row_count: 0
start_ms: 0
rows: []
type: sql_endpoint
schema:
$ref: '#/components/schemas/getGithubRepoStargazers_companyResponse'
description: The requested method is not supported for the specified resource
"408":
content:
application/json:
example:
data:
columns: []
result:
code: 408
end_ms: 0
latency: ""
limit: 0
message: request timeout
row_affect: 0
row_count: 0
start_ms: 0
rows: []
type: sql_endpoint
schema:
$ref: '#/components/schemas/getGithubRepoStargazers_companyResponse'
description: The server timed out waiting for the request
"429":
content:
application/json:
example:
data:
columns: []
result:
code: 429
end_ms: 0
latency: ""
limit: 0
message: 'The request exceeded the limit of 100 times per apikey
per minute. For more quota, please contact us: https://support.pingcap.com/hc/en-us/requests/new?ticket_form_id=7800003722519'
row_affect: 0
row_count: 0
start_ms: 0
rows: []
type: sql_endpoint
schema:
$ref: '#/components/schemas/getGithubRepoStargazers_companyResponse'
description: The user has sent too many requests in a given amount of time
"500":
content:
application/json:
example:
data:
columns: []
result:
code: 500
end_ms: 0
latency: ""
limit: 0
message: internal error! {detailed error}
row_affect: 0
row_count: 0
start_ms: 0
rows: []
type: sql_endpoint
schema:
$ref: '#/components/schemas/getGithubRepoStargazers_companyResponse'
description: Internal server error
summary: /github/repo/stargazers_company
tags:
- Default
/github/repo/stargazers_country:
get:
description: github repo stargazers country
operationId: getGithubRepoStargazers_country
parameters:
- in: query
name: owner
schema:
default: ""
example: ""
type: string
- in: query
name: repo
schema:
default: ""
example: ""
type: string
- in: query
name: from
schema:
default: "2000-01-01"
example: "2000-01-01"
type: string
- in: query
name: to
schema:
default: "2099-01-01"
example: "2099-01-01"
type: string
- in: query
name: exclude_unknown
schema:
default: "true"
example: "true"
type: boolean
responses:
"200":
content:
application/json:
schema:
$ref: '#/components/schemas/getGithubRepoStargazers_countryResponse'
description: OK
"400":
content:
application/json:
example:
data:
columns: []
result:
code: 400
end_ms: 0
latency: ""
limit: 0
message: param check failed! {detailed error}
row_affect: 0
row_count: 0
start_ms: 0
rows: []
type: sql_endpoint
schema:
$ref: '#/components/schemas/getGithubRepoStargazers_countryResponse'
description: Bad request
"401":
content:
application/json:
example:
data:
columns: []
result:
code: 401
end_ms: 0
latency: ""
limit: 0
message: auth failed
row_affect: 0
row_count: 0
start_ms: 0
rows: []
type: sql_endpoint
schema:
$ref: '#/components/schemas/getGithubRepoStargazers_countryResponse'
description: Unauthorized request
"404":
content:
application/json:
example:
data:
columns: []
result:
code: 404
end_ms: 0
latency: ""
limit: 0
message: endpoint not found
row_affect: 0
row_count: 0
start_ms: 0
rows: []
type: sql_endpoint
schema:
$ref: '#/components/schemas/getGithubRepoStargazers_countryResponse'
description: The requested resource was not found
"405":
content:
application/json:
example:
data:
columns: []
result:
code: 405
end_ms: 0
latency: ""
limit: 0
message: method not allowed
row_affect: 0
row_count: 0
start_ms: 0
rows: []
type: sql_endpoint
schema:
$ref: '#/components/schemas/getGithubRepoStargazers_countryResponse'
description: The requested method is not supported for the specified resource
"408":
content:
application/json:
example:
data:
columns: []
result:
code: 408
end_ms: 0
latency: ""
limit: 0
message: request timeout
row_affect: 0
row_count: 0
start_ms: 0
rows: []
type: sql_endpoint
schema:
$ref: '#/components/schemas/getGithubRepoStargazers_countryResponse'
description: The server timed out waiting for the request
"429":
content:
application/json:
example:
data:
columns: []
result:
code: 429
end_ms: 0
latency: ""
limit: 0
message: 'The request exceeded the limit of 100 times per apikey
per minute. For more quota, please contact us: https://support.pingcap.com/hc/en-us/requests/new?ticket_form_id=7800003722519'
row_affect: 0
row_count: 0
start_ms: 0
rows: []
type: sql_endpoint
schema:
$ref: '#/components/schemas/getGithubRepoStargazers_countryResponse'
description: The user has sent too many requests in a given amount of time
"500":
content:
application/json:
example:
data:
columns: []
result:
code: 500
end_ms: 0
latency: ""
limit: 0
message: internal error! {detailed error}
row_affect: 0
row_count: 0
start_ms: 0
rows: []
type: sql_endpoint
schema:
$ref: '#/components/schemas/getGithubRepoStargazers_countryResponse'
description: Internal server error
summary: /github/repo/stargazers_country
tags:
- Default
/hackernews/mentions_count:
get:
description: Total counts for keyword in hackernews
operationId: getHackernewsMentions_count
parameters:
- in: query
name: keyword
schema:
default: ""
example: ""
type: string
responses:
"200":
content:
application/json:
schema:
$ref: '#/components/schemas/getHackernewsMentions_countResponse'
description: OK
"400":
content:
application/json:
example:
data:
columns: []
result:
code: 400
end_ms: 0
latency: ""
limit: 0
message: param check failed! {detailed error}
row_affect: 0
row_count: 0
start_ms: 0
rows: []
type: sql_endpoint
schema:
$ref: '#/components/schemas/getHackernewsMentions_countResponse'
description: Bad request
"401":
content:
application/json:
example:
data:
columns: []
result:
code: 401
end_ms: 0
latency: ""
limit: 0
message: auth failed
row_affect: 0
row_count: 0
start_ms: 0
rows: []
type: sql_endpoint
schema:
$ref: '#/components/schemas/getHackernewsMentions_countResponse'
description: Unauthorized request
"404":
content:
application/json:
example:
data:
columns: []
result:
code: 404
end_ms: 0
latency: ""
limit: 0
message: endpoint not found
row_affect: 0
row_count: 0
start_ms: 0
rows: []
type: sql_endpoint
schema:
$ref: '#/components/schemas/getHackernewsMentions_countResponse'
description: The requested resource was not found
"405":
content:
application/json:
example:
data:
columns: []
result:
code: 405
end_ms: 0
latency: ""
limit: 0
message: method not allowed
row_affect: 0
row_count: 0
start_ms: 0
rows: []
type: sql_endpoint
schema:
$ref: '#/components/schemas/getHackernewsMentions_countResponse'
description: The requested method is not supported for the specified resource
"408":
content:
application/json:
example:
data:
columns: []
result:
code: 408
end_ms: 0
latency: ""
limit: 0
message: request timeout
row_affect: 0
row_count: 0
start_ms: 0
rows: []
type: sql_endpoint
schema:
$ref: '#/components/schemas/getHackernewsMentions_countResponse'
description: The server timed out waiting for the request
"429":
content:
application/json:
example:
data:
columns: []
result:
code: 429
end_ms: 0
latency: ""
limit: 0
message: 'The request exceeded the limit of 100 times per apikey
per minute. For more quota, please contact us: https://support.pingcap.com/hc/en-us/requests/new?ticket_form_id=7800003722519'
row_affect: 0
row_count: 0
start_ms: 0
rows: []
type: sql_endpoint
schema:
$ref: '#/components/schemas/getHackernewsMentions_countResponse'
description: The user has sent too many requests in a given amount of time
"500":
content:
application/json:
example:
data:
columns: []
result:
code: 500
end_ms: 0
latency: ""
limit: 0
message: internal error! {detailed error}
row_affect: 0
row_count: 0
start_ms: 0
rows: []
type: sql_endpoint
schema:
$ref: '#/components/schemas/getHackernewsMentions_countResponse'
description: Internal server error
summary: /hackernews/mentions_count
tags:
- Default
/hackernews/mentions_per_year:
get:
description: keyword mentions per year in hackernews
operationId: getHackernewsMentions_per_year
parameters:
- in: query
name: keyword
schema:
default: ""
example: ""
type: string
responses:
"200":
content:
application/json:
schema:
$ref: '#/components/schemas/getHackernewsMentions_per_yearResponse'
description: OK
"400":
content:
application/json:
example:
data:
columns: []
result:
code: 400
end_ms: 0
latency: ""
limit: 0
message: param check failed! {detailed error}
row_affect: 0
row_count: 0
start_ms: 0
rows: []
type: sql_endpoint
schema:
$ref: '#/components/schemas/getHackernewsMentions_per_yearResponse'
description: Bad request
"401":
content:
application/json:
example:
data:
columns: []
result:
code: 401
end_ms: 0
latency: ""
limit: 0
message: auth failed
row_affect: 0
row_count: 0
start_ms: 0
rows: []
type: sql_endpoint
schema:
$ref: '#/components/schemas/getHackernewsMentions_per_yearResponse'
description: Unauthorized request
"404":
content:
application/json:
example:
data:
columns: []
result:
code: 404
end_ms: 0
latency: ""
limit: 0
message: endpoint not found
row_affect: 0
row_count: 0
start_ms: 0
rows: []
type: sql_endpoint
schema:
$ref: '#/components/schemas/getHackernewsMentions_per_yearResponse'
description: The requested resource was not found
"405":
content:
application/json:
example:
data:
columns: []
result:
code: 405
end_ms: 0
latency: ""
limit: 0
message: method not allowed
row_affect: 0
row_count: 0
start_ms: 0
rows: []
type: sql_endpoint
schema:
$ref: '#/components/schemas/getHackernewsMentions_per_yearResponse'
description: The requested method is not supported for the specified resource
"408":
content:
application/json:
example:
data:
columns: []
result:
code: 408
end_ms: 0
latency: ""
limit: 0
message: request timeout
row_affect: 0
row_count: 0
start_ms: 0
rows: []
type: sql_endpoint
schema:
$ref: '#/components/schemas/getHackernewsMentions_per_yearResponse'
description: The server timed out waiting for the request
"429":
content:
application/json:
example:
data:
columns: []
result:
code: 429
end_ms: 0
latency: ""
limit: 0
message: 'The request exceeded the limit of 100 times per apikey
per minute. For more quota, please contact us: https://support.pingcap.com/hc/en-us/requests/new?ticket_form_id=7800003722519'
row_affect: 0
row_count: 0
start_ms: 0
rows: []
type: sql_endpoint
schema:
$ref: '#/components/schemas/getHackernewsMentions_per_yearResponse'
description: The user has sent too many requests in a given amount of time
"500":
content:
application/json:
example:
data:
columns: []
result:
code: 500
end_ms: 0
latency: ""
limit: 0
message: internal error! {detailed error}
row_affect: 0
row_count: 0
start_ms: 0
rows: []
type: sql_endpoint
schema:
$ref: '#/components/schemas/getHackernewsMentions_per_yearResponse'
description: Internal server error
summary: /hackernews/mentions_per_year
tags:
- Default
security:
- basicAuth: []
servers:
- url: https://us-west-2.data.tidbcloud.com/api/v1beta/app/dataapp-RfFKcZFu/endpoint

API Key

When config this action, you should input the following encoded api key in Authentication -> API Key -> Auth Type(Basic)

QzBTQ0VRNzA6MmJjNjAwYzUtODA0Mi00Yzg4LTkxNTgtMTNiNzdkMDY0OGM5
Note!
  • Make sure using this key for GPT's learning, thanks~
  • We will revoke this key after a period of time
Privacy policy
https://www.pingcap.com/privacy-policy/

· 2 min read
PingCAP
ChatGPT

SQL is a powerful language for managing and analyzing data, but it can be difficult to learn for beginners. That's where ChatGPT comes in.

ChatGPT is a large language model trained by OpenAI that can help you learn SQL easily by visualizing the key information in a SQL query. In this blog post, we'll show you how to use ChatGPT to visualize SQL queries using pretty ASCII art diagrams. Let's start with an example. Suppose we want to find the top 10 most popular AI projects on GitHub in the last month. Here's the SQL query that does that:

SELECT
repo_name,
COUNT(*) AS stars
FROM
github_events
WHERE
type = 'WatchEvent'
AND created_at > DATE_SUB(NOW(), INTERVAL 1 MONTH)
AND repo_name LIKE '%AI%'
GROUP BY
repo_name
ORDER BY
stars DESC
LIMIT
10

Now, let's use ChatGPT to visualize this SQL query using pretty ASCII art diagrams. Here's the diagram:

          +-------------------+            
| What to Retrieve? | top 10
+-------------------+
| SELECT
| repo_name,
| COUNT(*) AS stars
v
+-------------------+
| From Where? | GitHub
+-------------------+
| FROM
| github_events
v
+-------------------+
| Filter By: | last month, AI projects, most popular
+-------------------+
| WHERE
| type = 'WatchEvent'
| AND created_at > DATE_SUB(NOW(), INTERVAL 1 MONTH)
| AND repo_name LIKE '%AI%'
v
+-------------------+
| Group By |
+-------------------+
| GROUP BY
| repo_name
v
+-------------------+
| Order By | most popular
+-------------------+
| ORDER BY
| stars DESC
v
+-------------------+
| Limit To 10 | top 10
+-------------------+
| LIMIT
| 10
v

This diagram visually shows the flow of the SQL query, from selecting what to retrieve, to filtering, grouping, ordering, and limiting the results. The arrows make it easy to see the relationship between the key information in the question and the corresponding SQL statements.

By using ChatGPT to visualize SQL queries with pretty ASCII art diagrams, you can learn SQL easily and quickly. The diagrams help you understand the structure of the SQL query, and make it easy to see how the various statements are related. With practice, you'll be able to write your own SQL queries in no time.

In conclusion, if you want to learn SQL easily, try using ChatGPT to visualize SQL queries with pretty ASCII art diagrams. It's a fun and effective way to learn SQL and improve your data management skills.

· 8 min read
Mia Zhou
Notion AI

A few days ago, I read a blog post by the author of Core-js. To be honest, it was my first time hearing about Core-js. As someone who has written some front-end code and has been keeping up with open source projects, I feel a bit ashamed.

However, there are many open source projects that are widely used but not well-known. In this blog post, I will take a closer look at a few of these unsung heroes of the open source world. I do not want to give them a business model or financial advice in this article. This largely depends on the author's personal experience and values. I just want to raise more awareness about these open source projects.

Core-js

Core-js is a modular standard library for JavaScript. It provides polyfills for many ECMAScript features, as well as some additional features that are not included in the standard library. It's used by many popular JavaScript libraries and frameworks, including React, Vue.js, and Angular.

Core-js has been downloaded more than 2.5 billion times from the npm package registry, making it one of the most widely used JavaScript libraries in the world. Despite its widespread use, the project does not receive much attention, and its star growth is very slow.

Core-js is maintained by Denis Pushkarev, who started the project as a hobby in 2012 and open-sourced it in 2014.


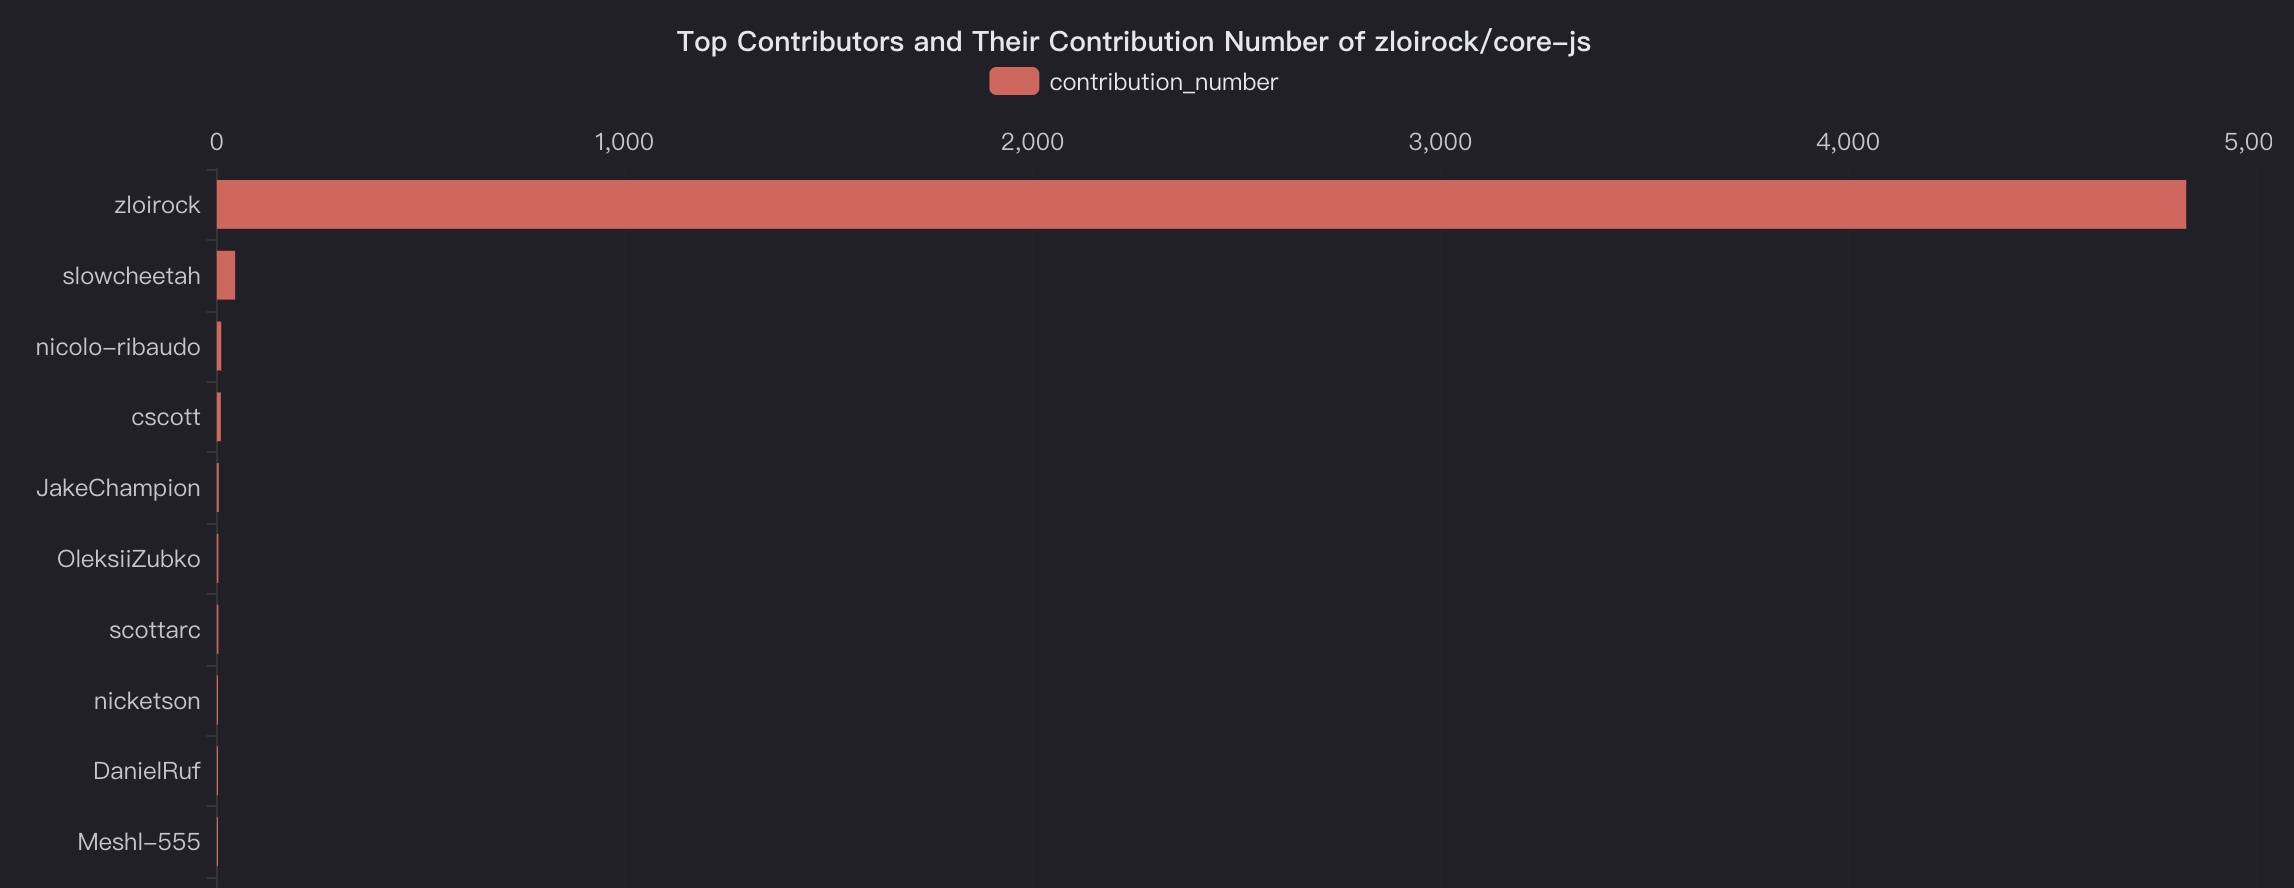
core-js-contributors
Core-js' top contributors

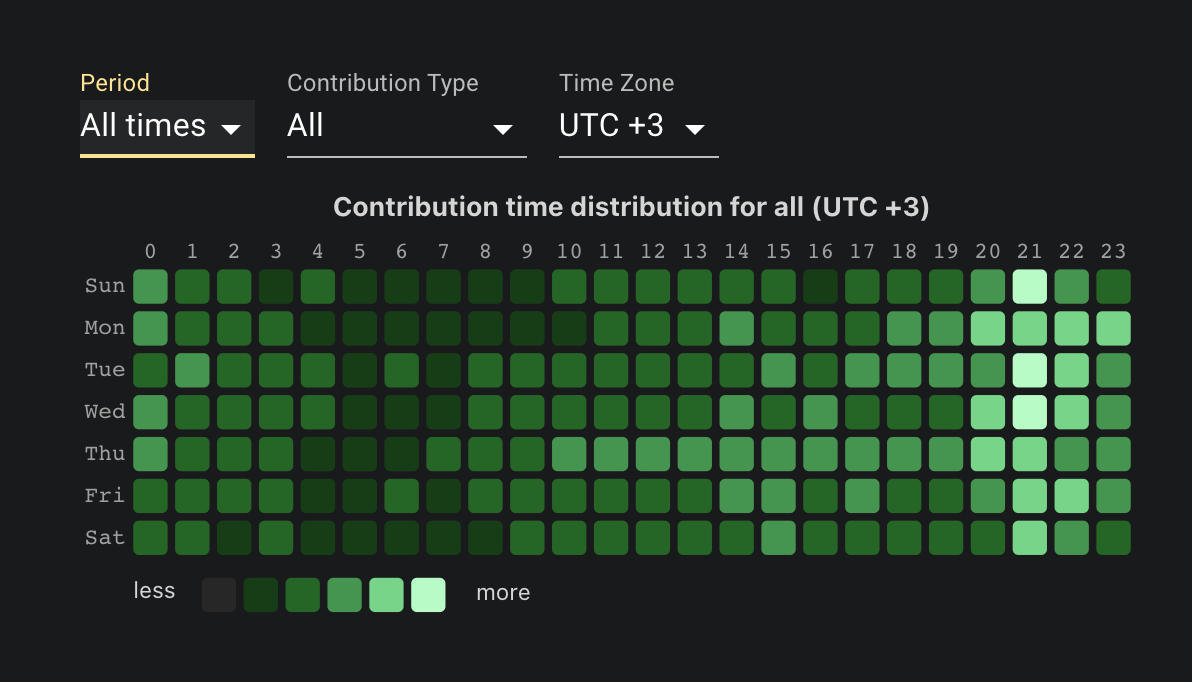
Based on the distribution of contributions to the project, it seems that Denis has provided more than 95% of the project's code. And as he said in the blog post I read, the project occupies almost all of his time—more than a full working day.


core-js-maintainer
Denis' contribution time distribution


core-js-star
Core-js' star history

On February 14th, Denis’s blog brought significant attention to the Core-js project. Now he has opened multiple donation channels, including through Open Collective, Patreon, and boosty. He is actively exploring ways to ensure that Core-js can be maintained in the long term.

cURL

cURL is a command-line tool and library for transferring data over a wide range of network protocols, including HTTP, FTP, SMTP, and many others. It is used by millions of developers to download and upload files, test APIs, and automate tasks.


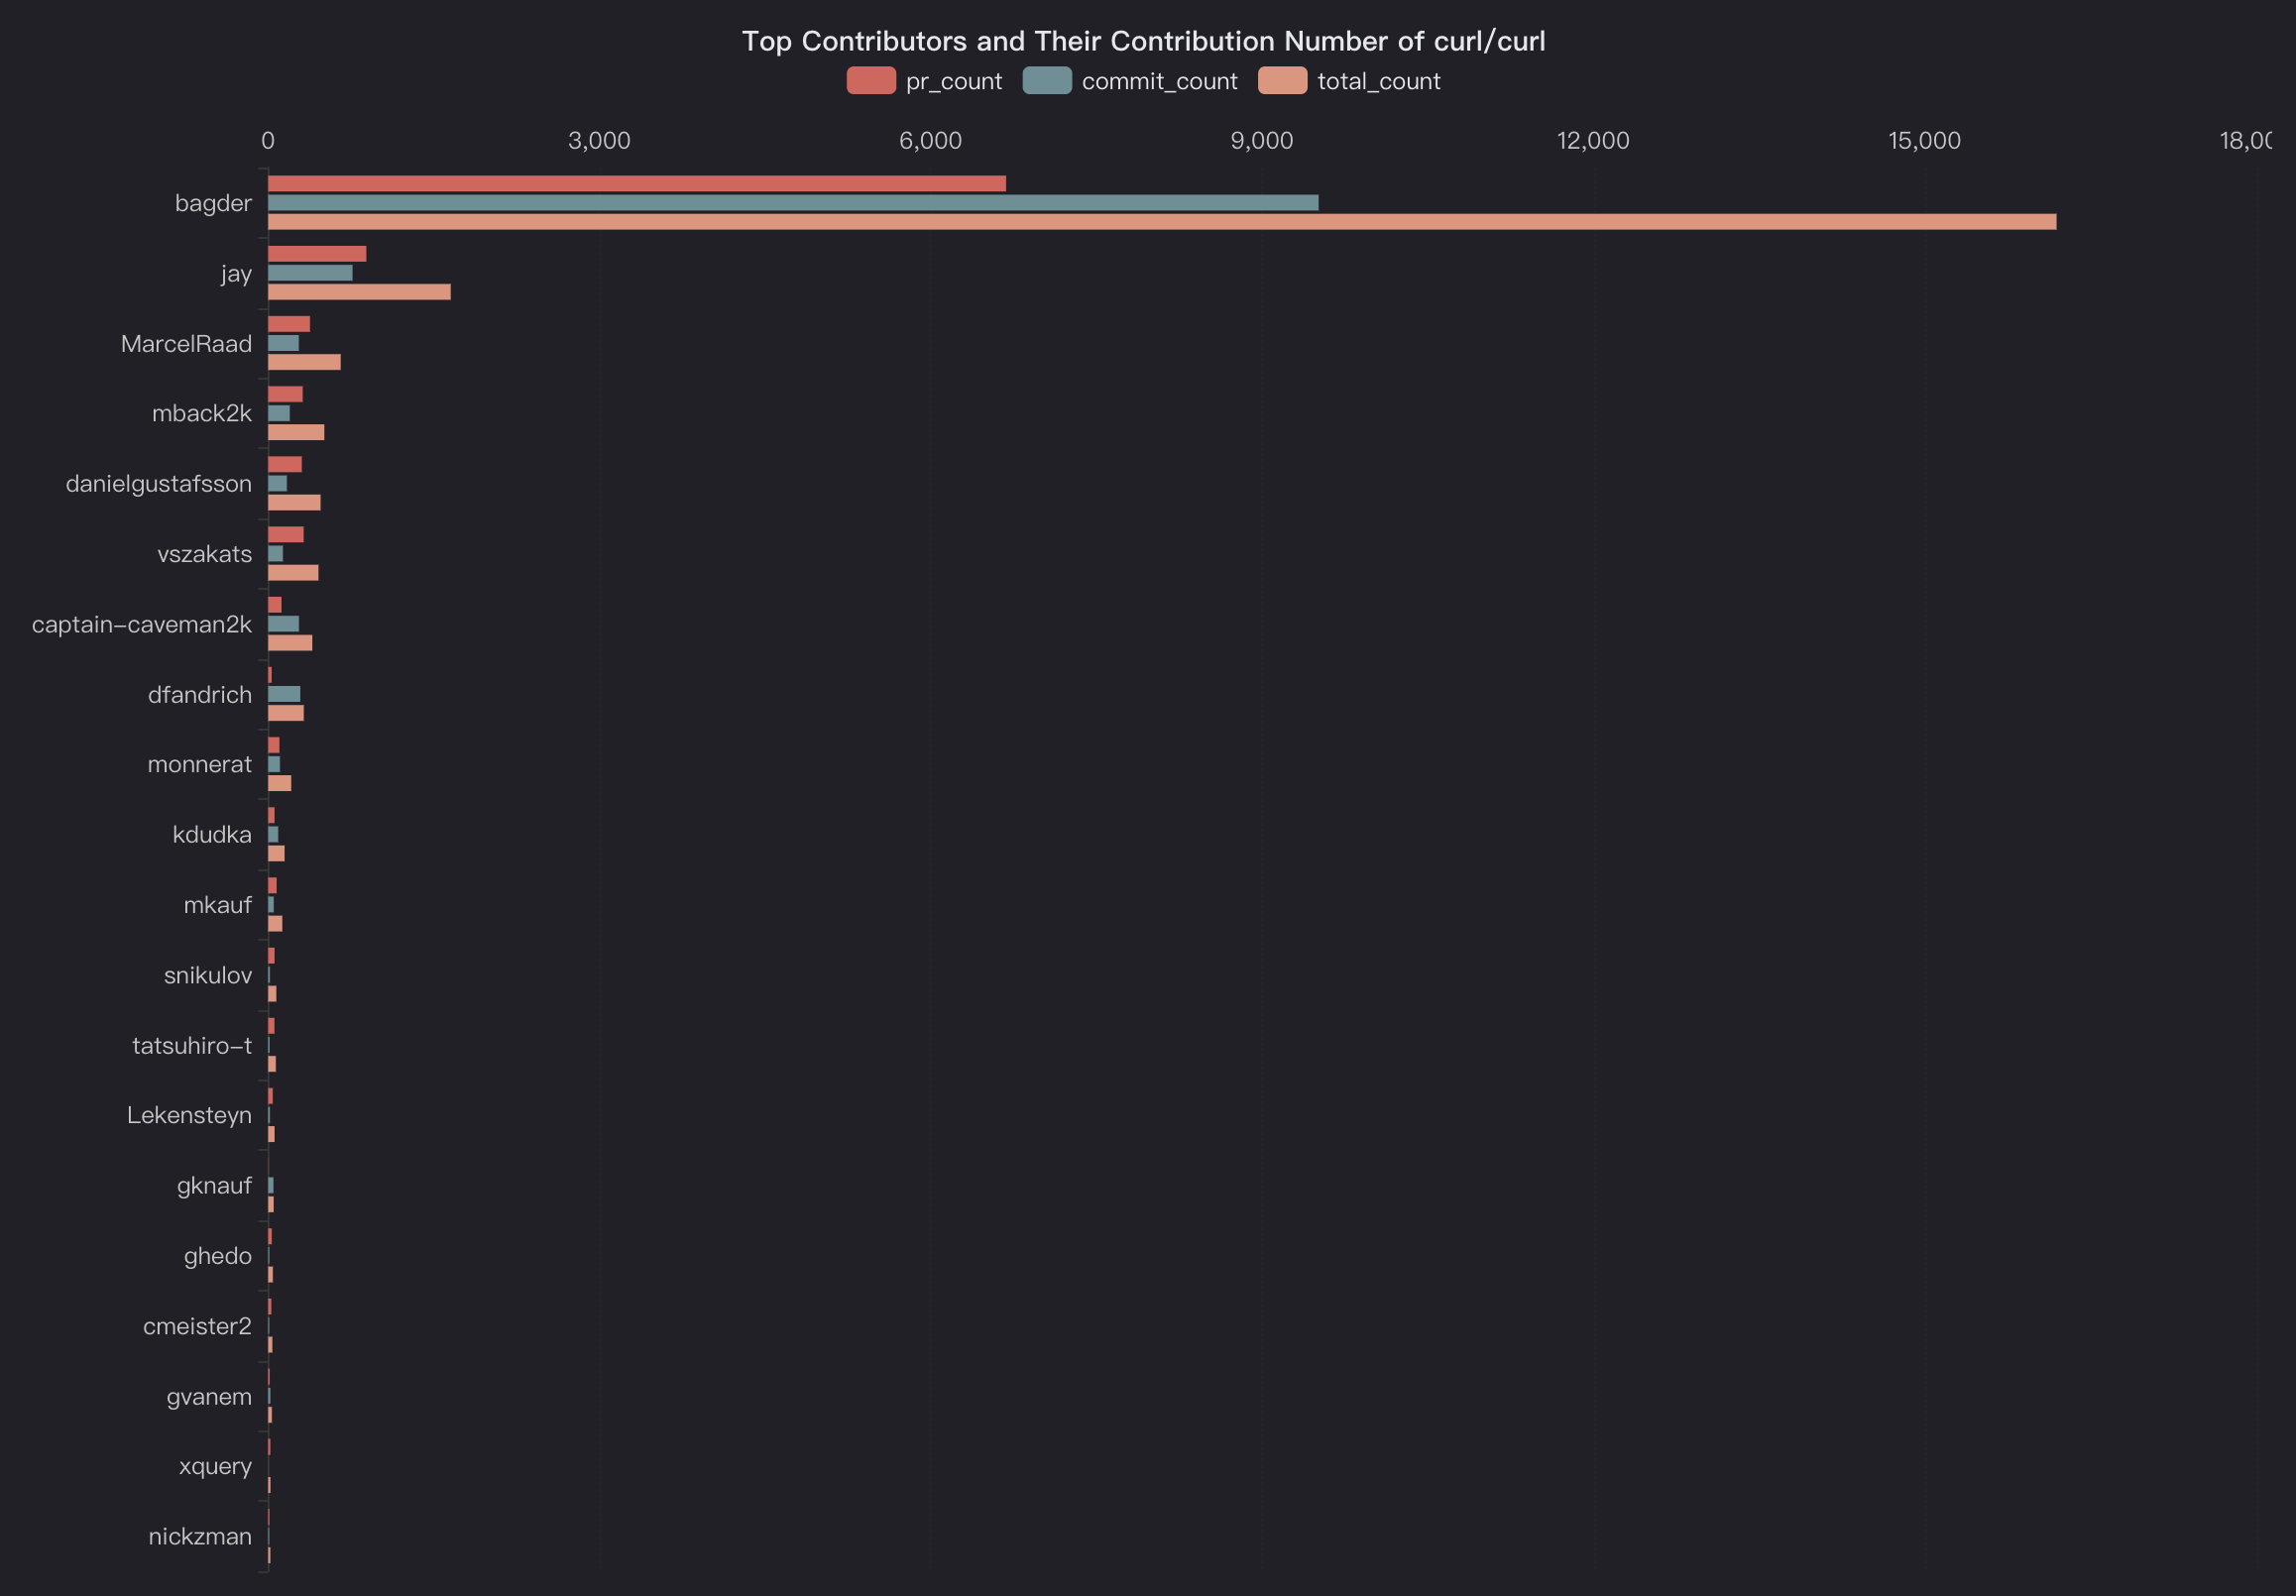
curl-contributor
cURL's top contributors

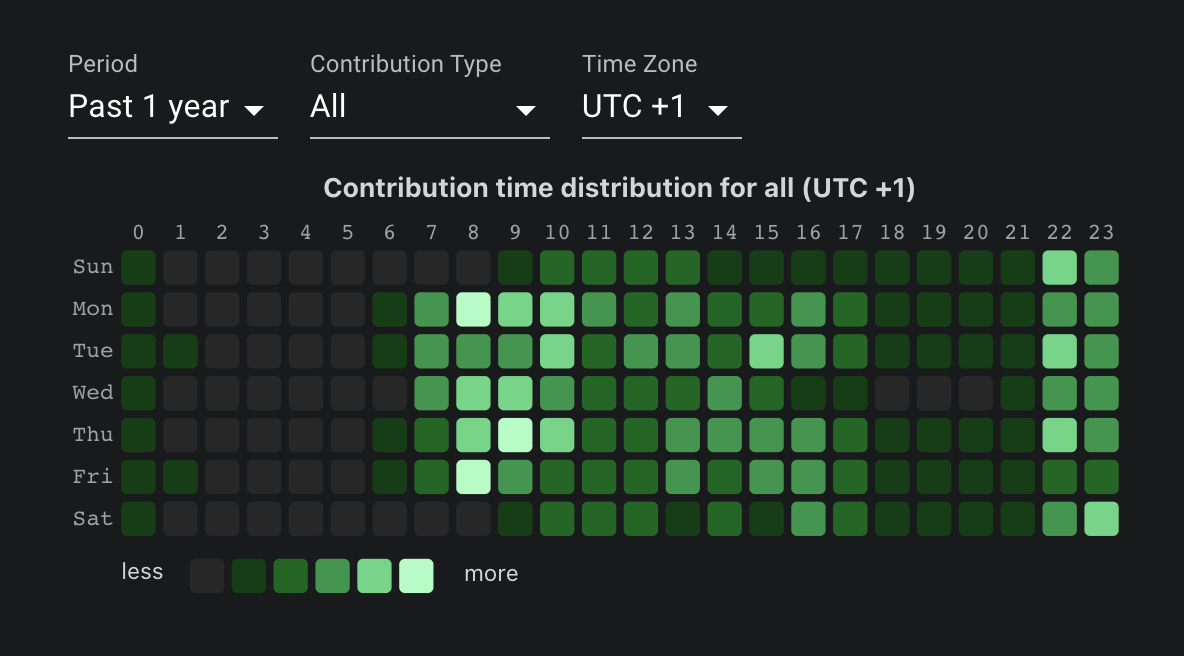
cURL is primarily maintained by Daniel Stenberg alone, who started working on the project in 1998. Fortunately, there are occasionally new contributors joining in as mentioned in this tweet. This allows Daniel to maintain a more normal schedule and a full time job, and even leave work early on Wednesdays to play floorball.


curl-maintainer
Daniel's contribution time distribution

cURL has received sponsorship from various organizations and individuals, including wolfSSL. WolfSSL employs Daniel and allows him to spend paid work hours on cURL.

ImageMagick

ImageMagick is a free and open-source software suite for displaying, converting, and editing raster image and vector image files. ImageMagick is used by millions of websites and applications to manipulate and display images, including popular content management systems like WordPress and Drupal.


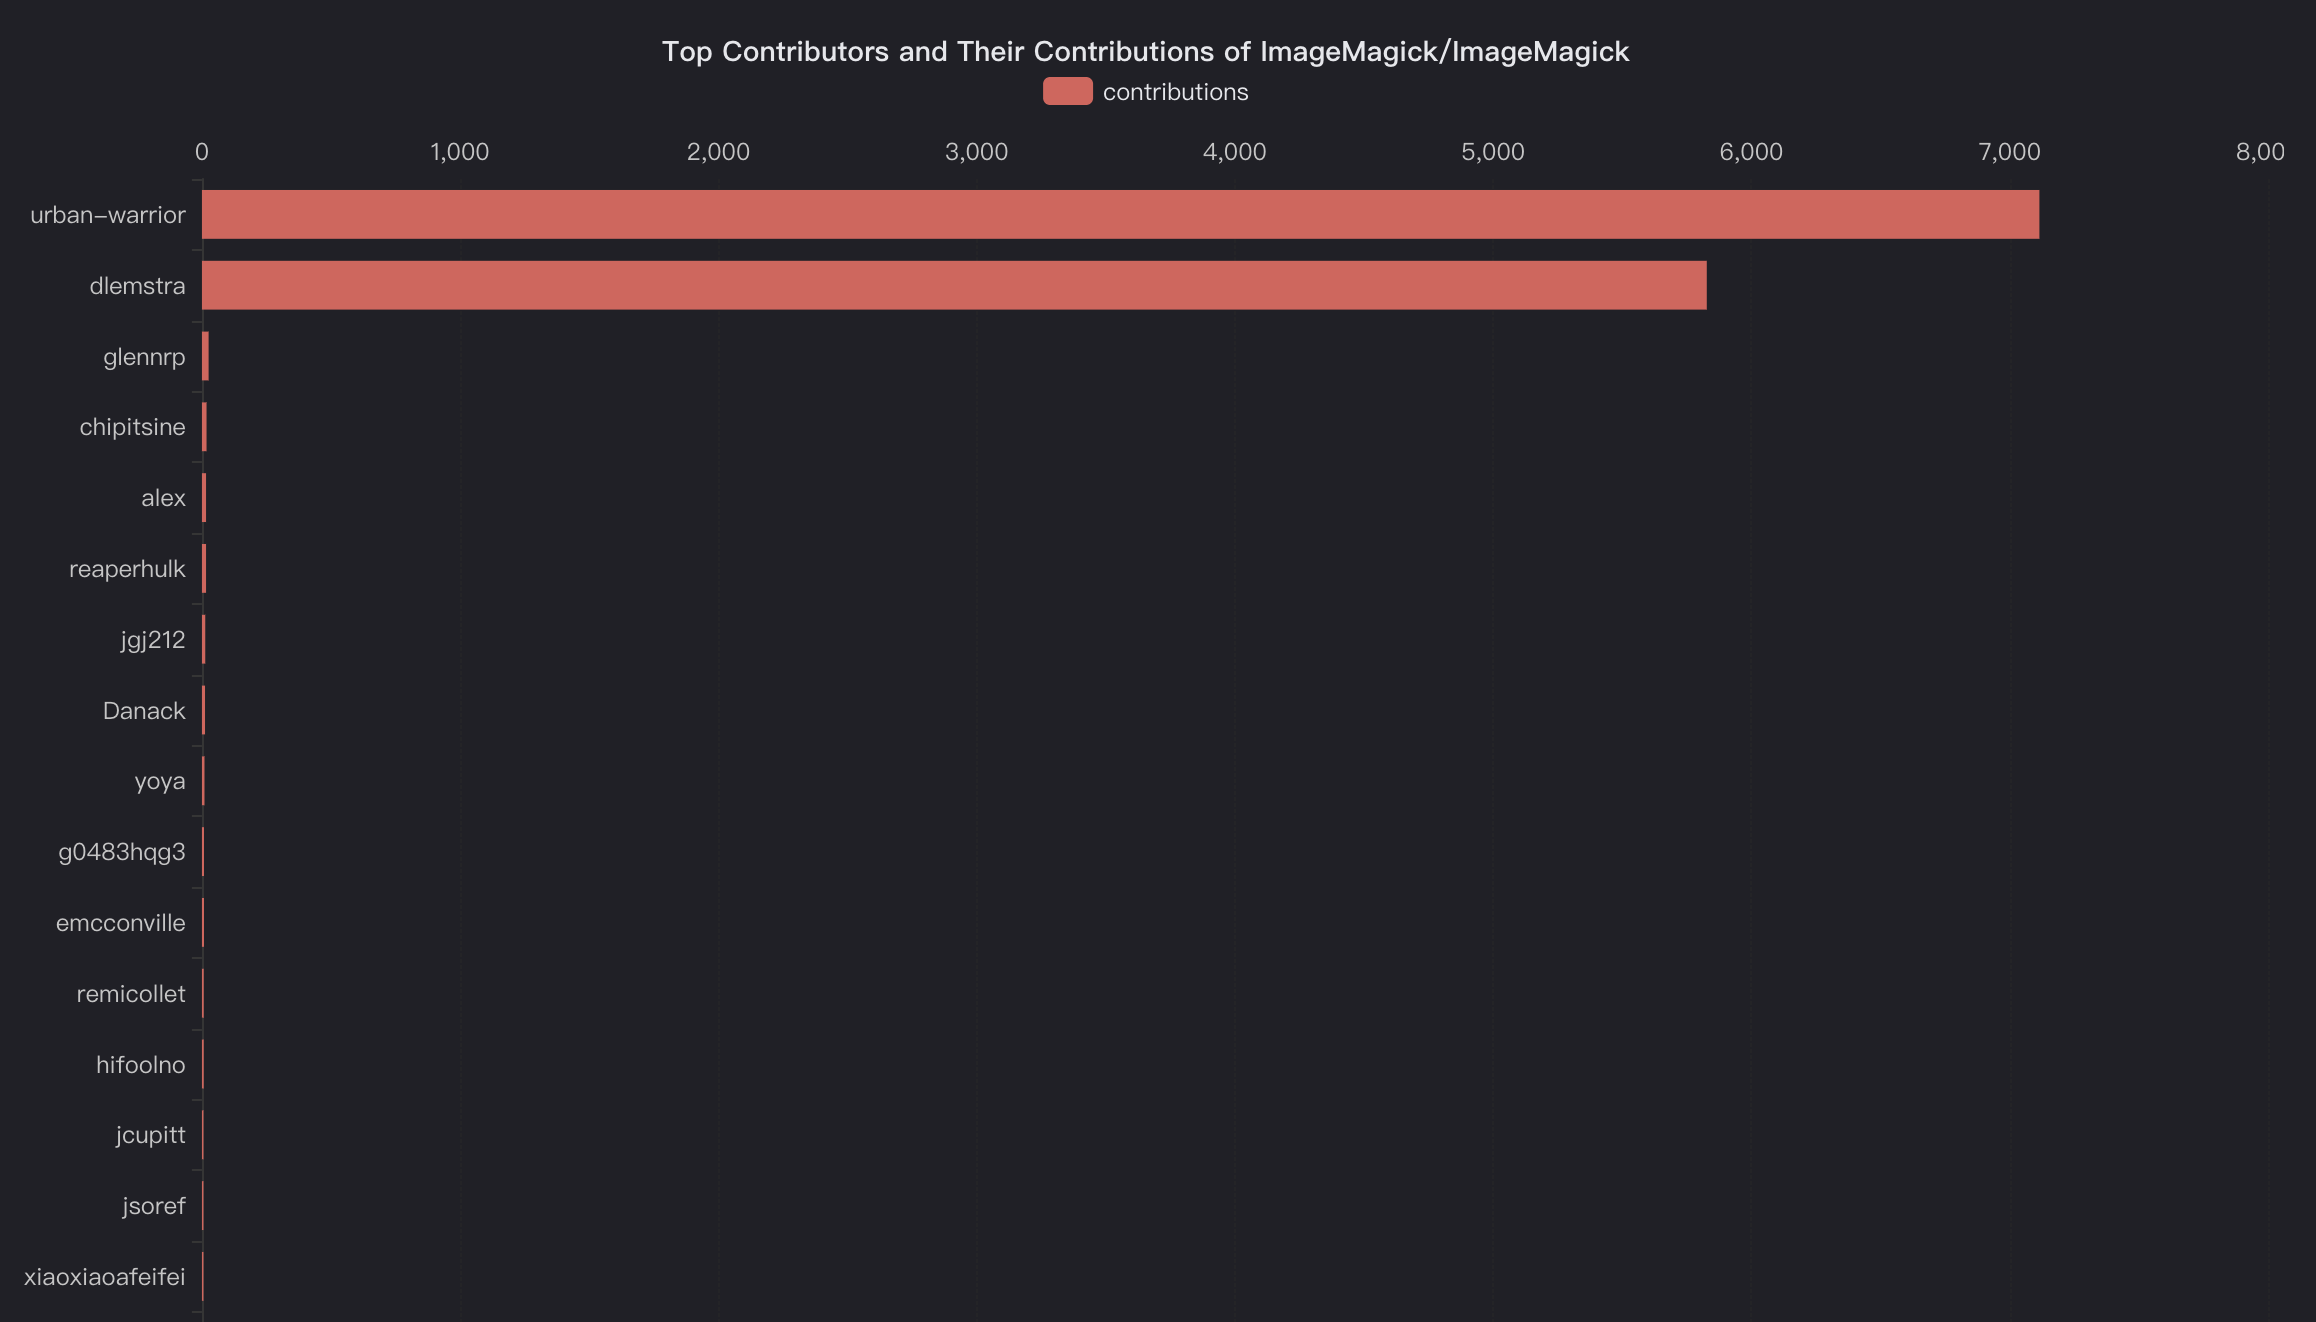
imagemagick-contributor
ImageMagick's top contributors

ImageMagick is maintained by a small group of developers, including its founder, John Cristy. Cristy started the project at DuPont in 1987 and released it in 1990. It is said that John Cristy has a full-time job and only maintains the project in his spare time.


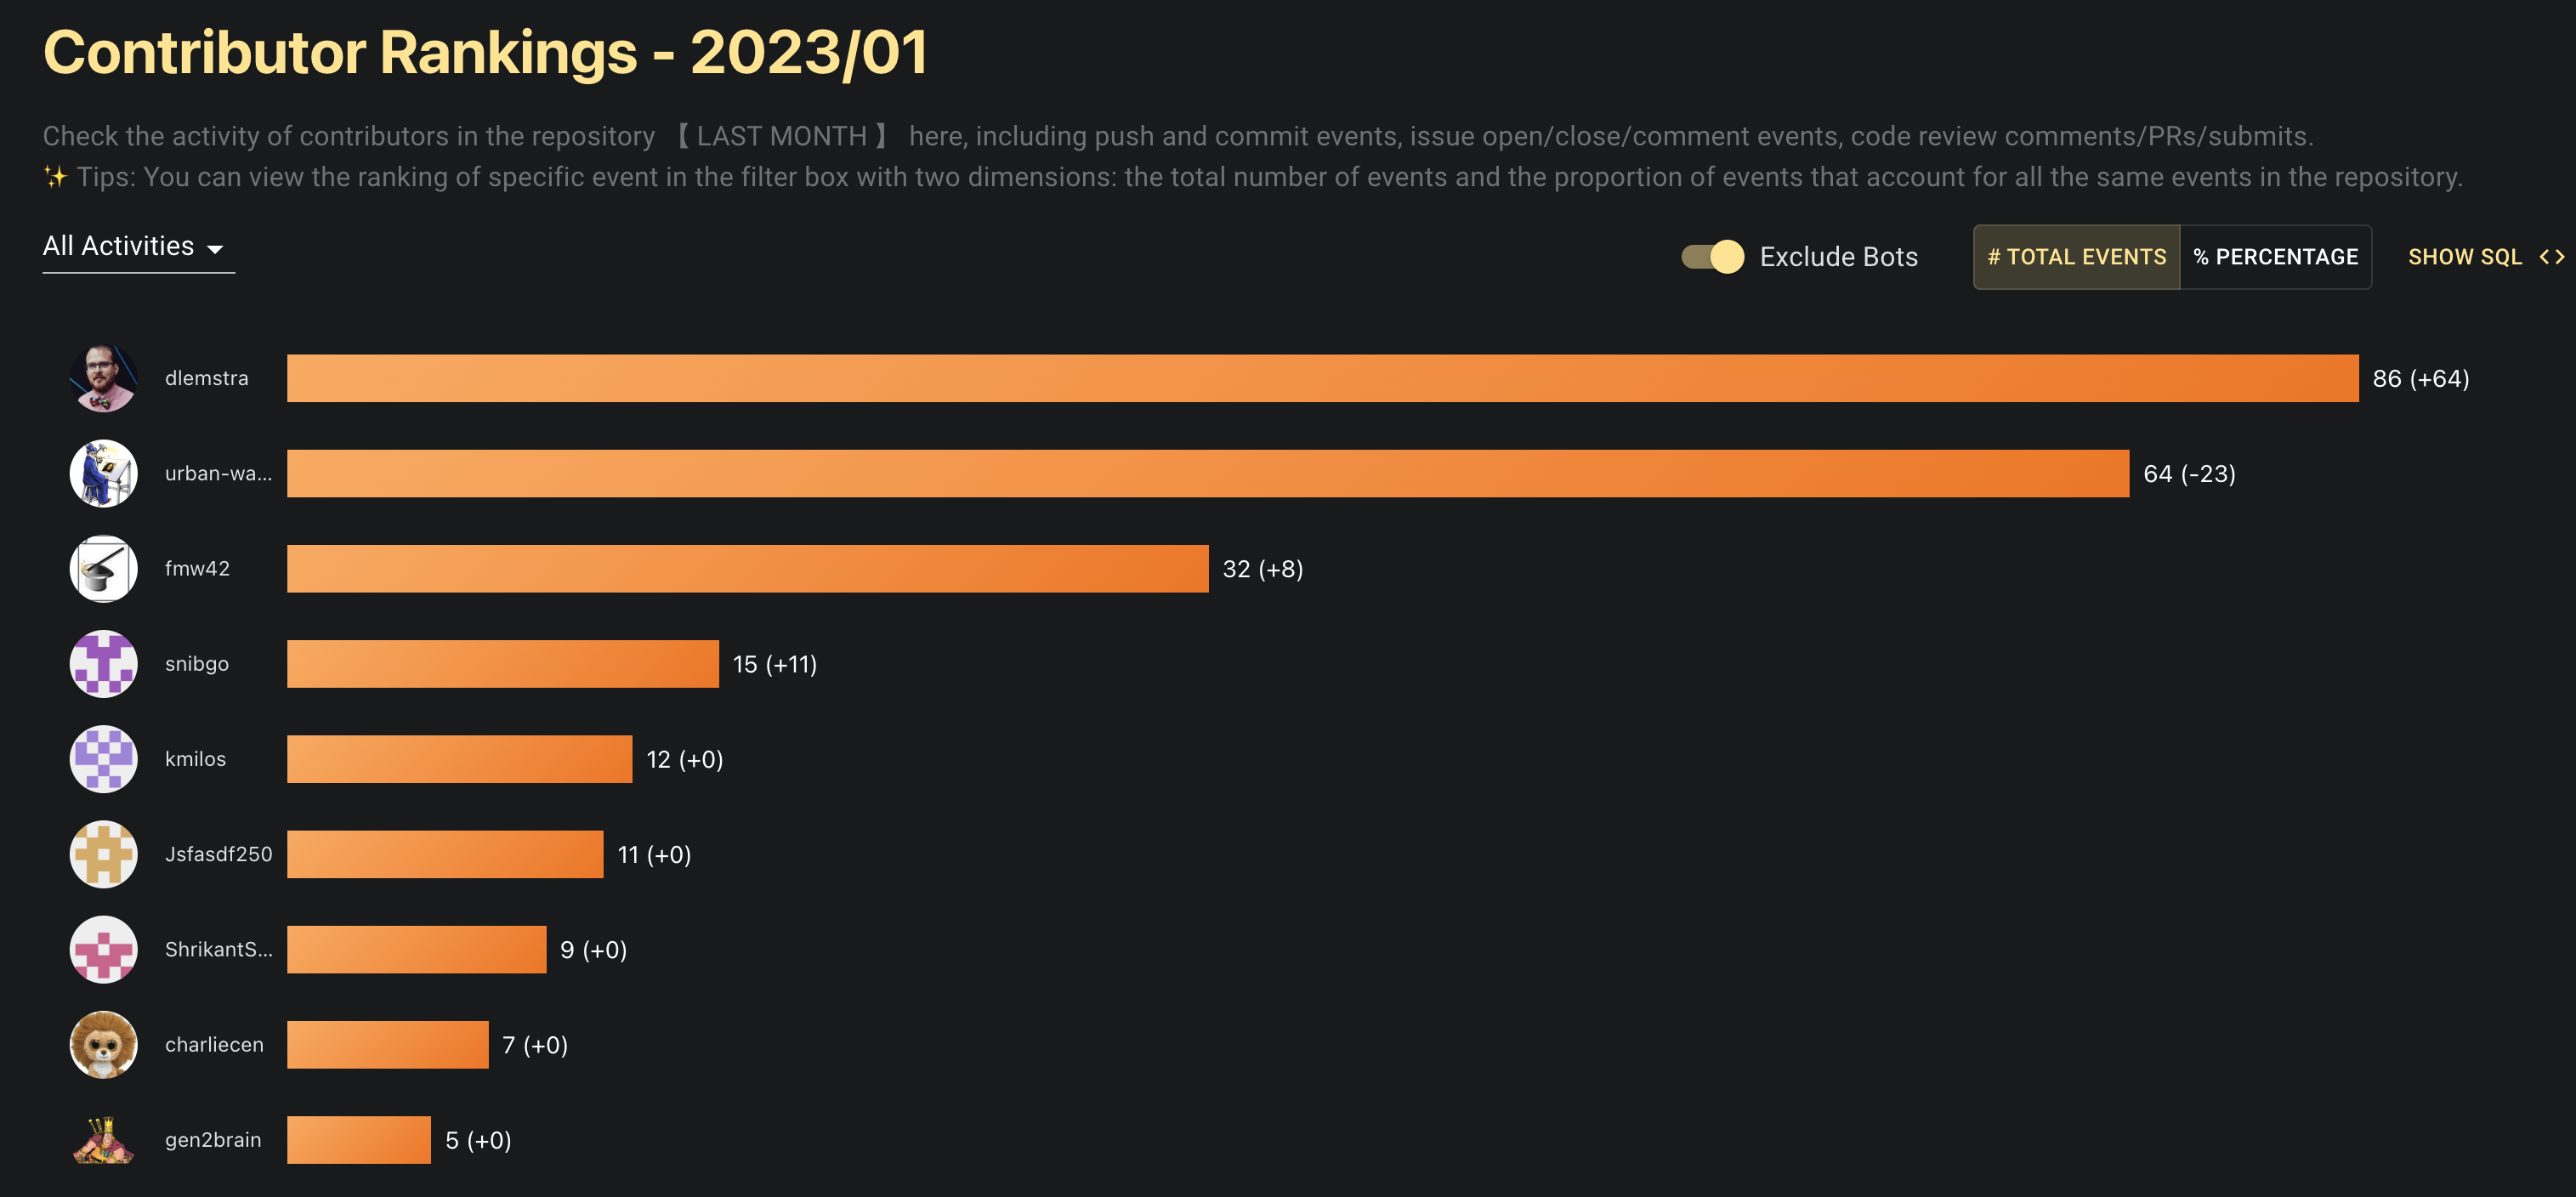
imagemagick-lastmonth
ImageMagick's top contributors last month

Dirk Lemstra is another primary maintainer of ImageMagick, currently working as a consultant for a company and maintaining the project in his spare time.

Currently, the project is sustained by the support of various organizations and individuals.

MyCLI

MyCLI is a command line interface for MySQL, MariaDB, and Percona with auto-completion and syntax highlighting.


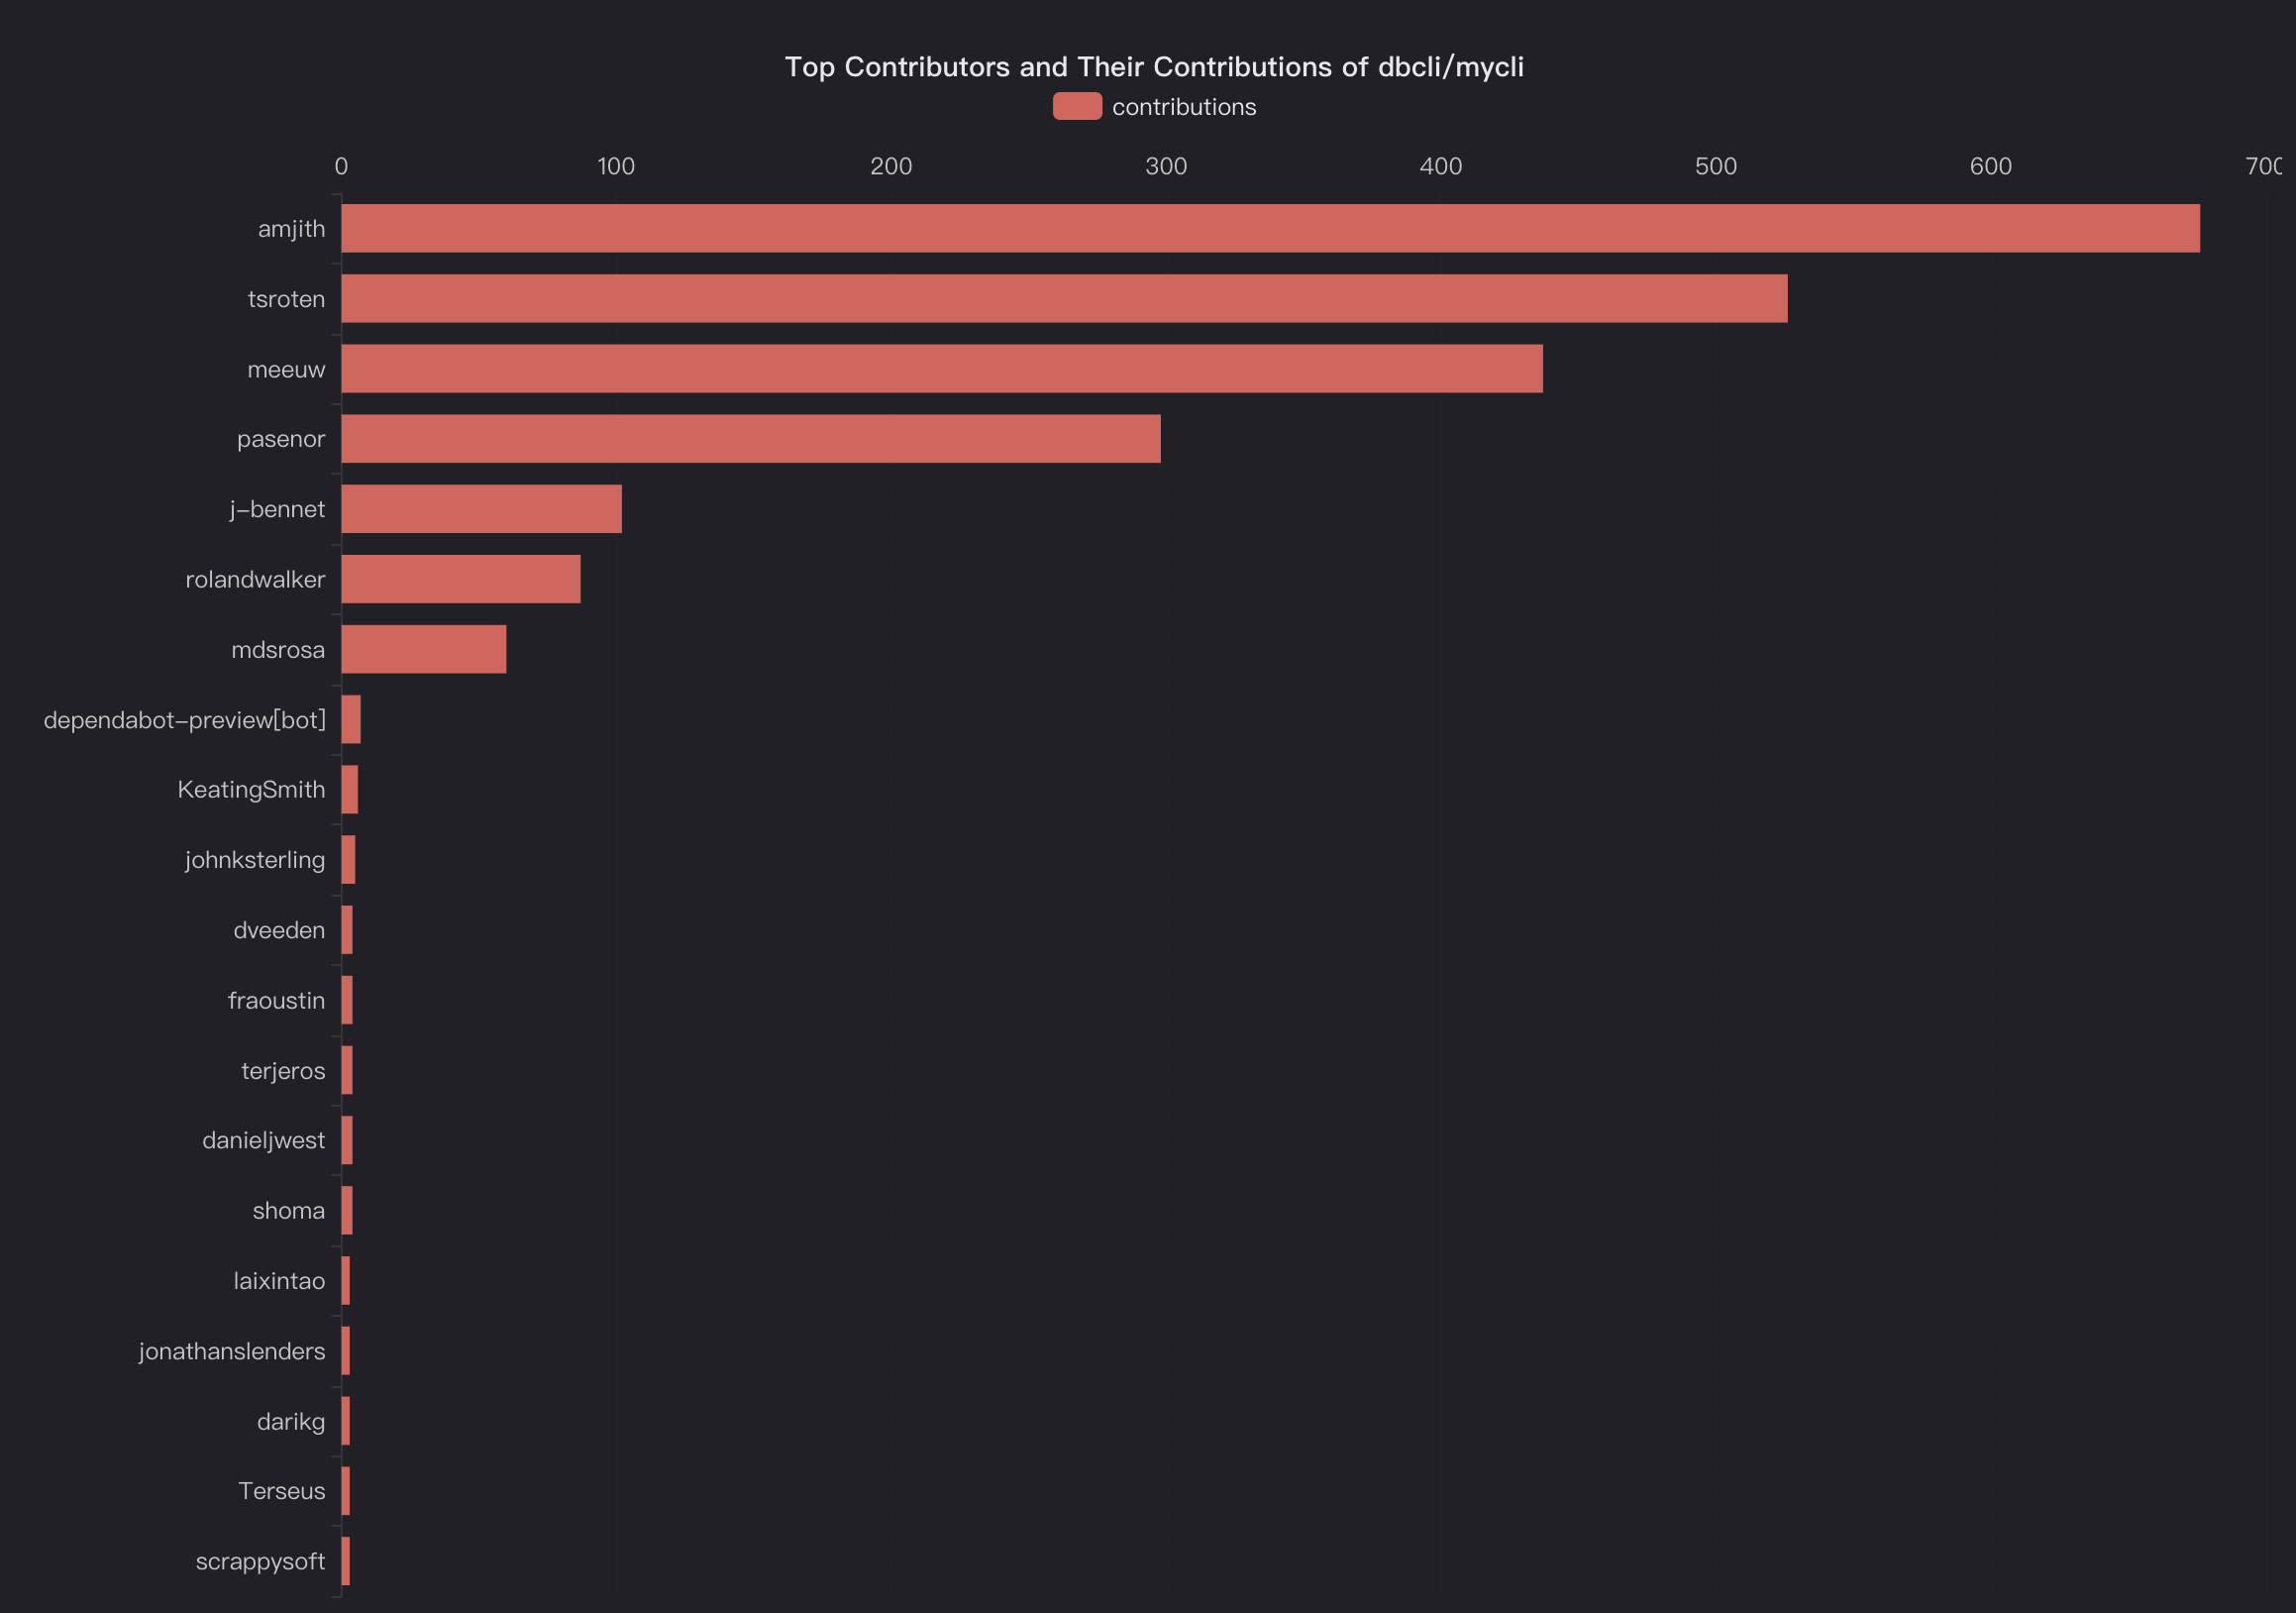
mycli-contributor
MyCLI's top contributors

The project is maintained by its creator, Amjith Ramanujam, and contributions from the open source community. Based on the distribution of contributions, a relatively stable community of contributors has formed around MyCLI. Moreover, there are some organizations and individuals sponsoring this project.


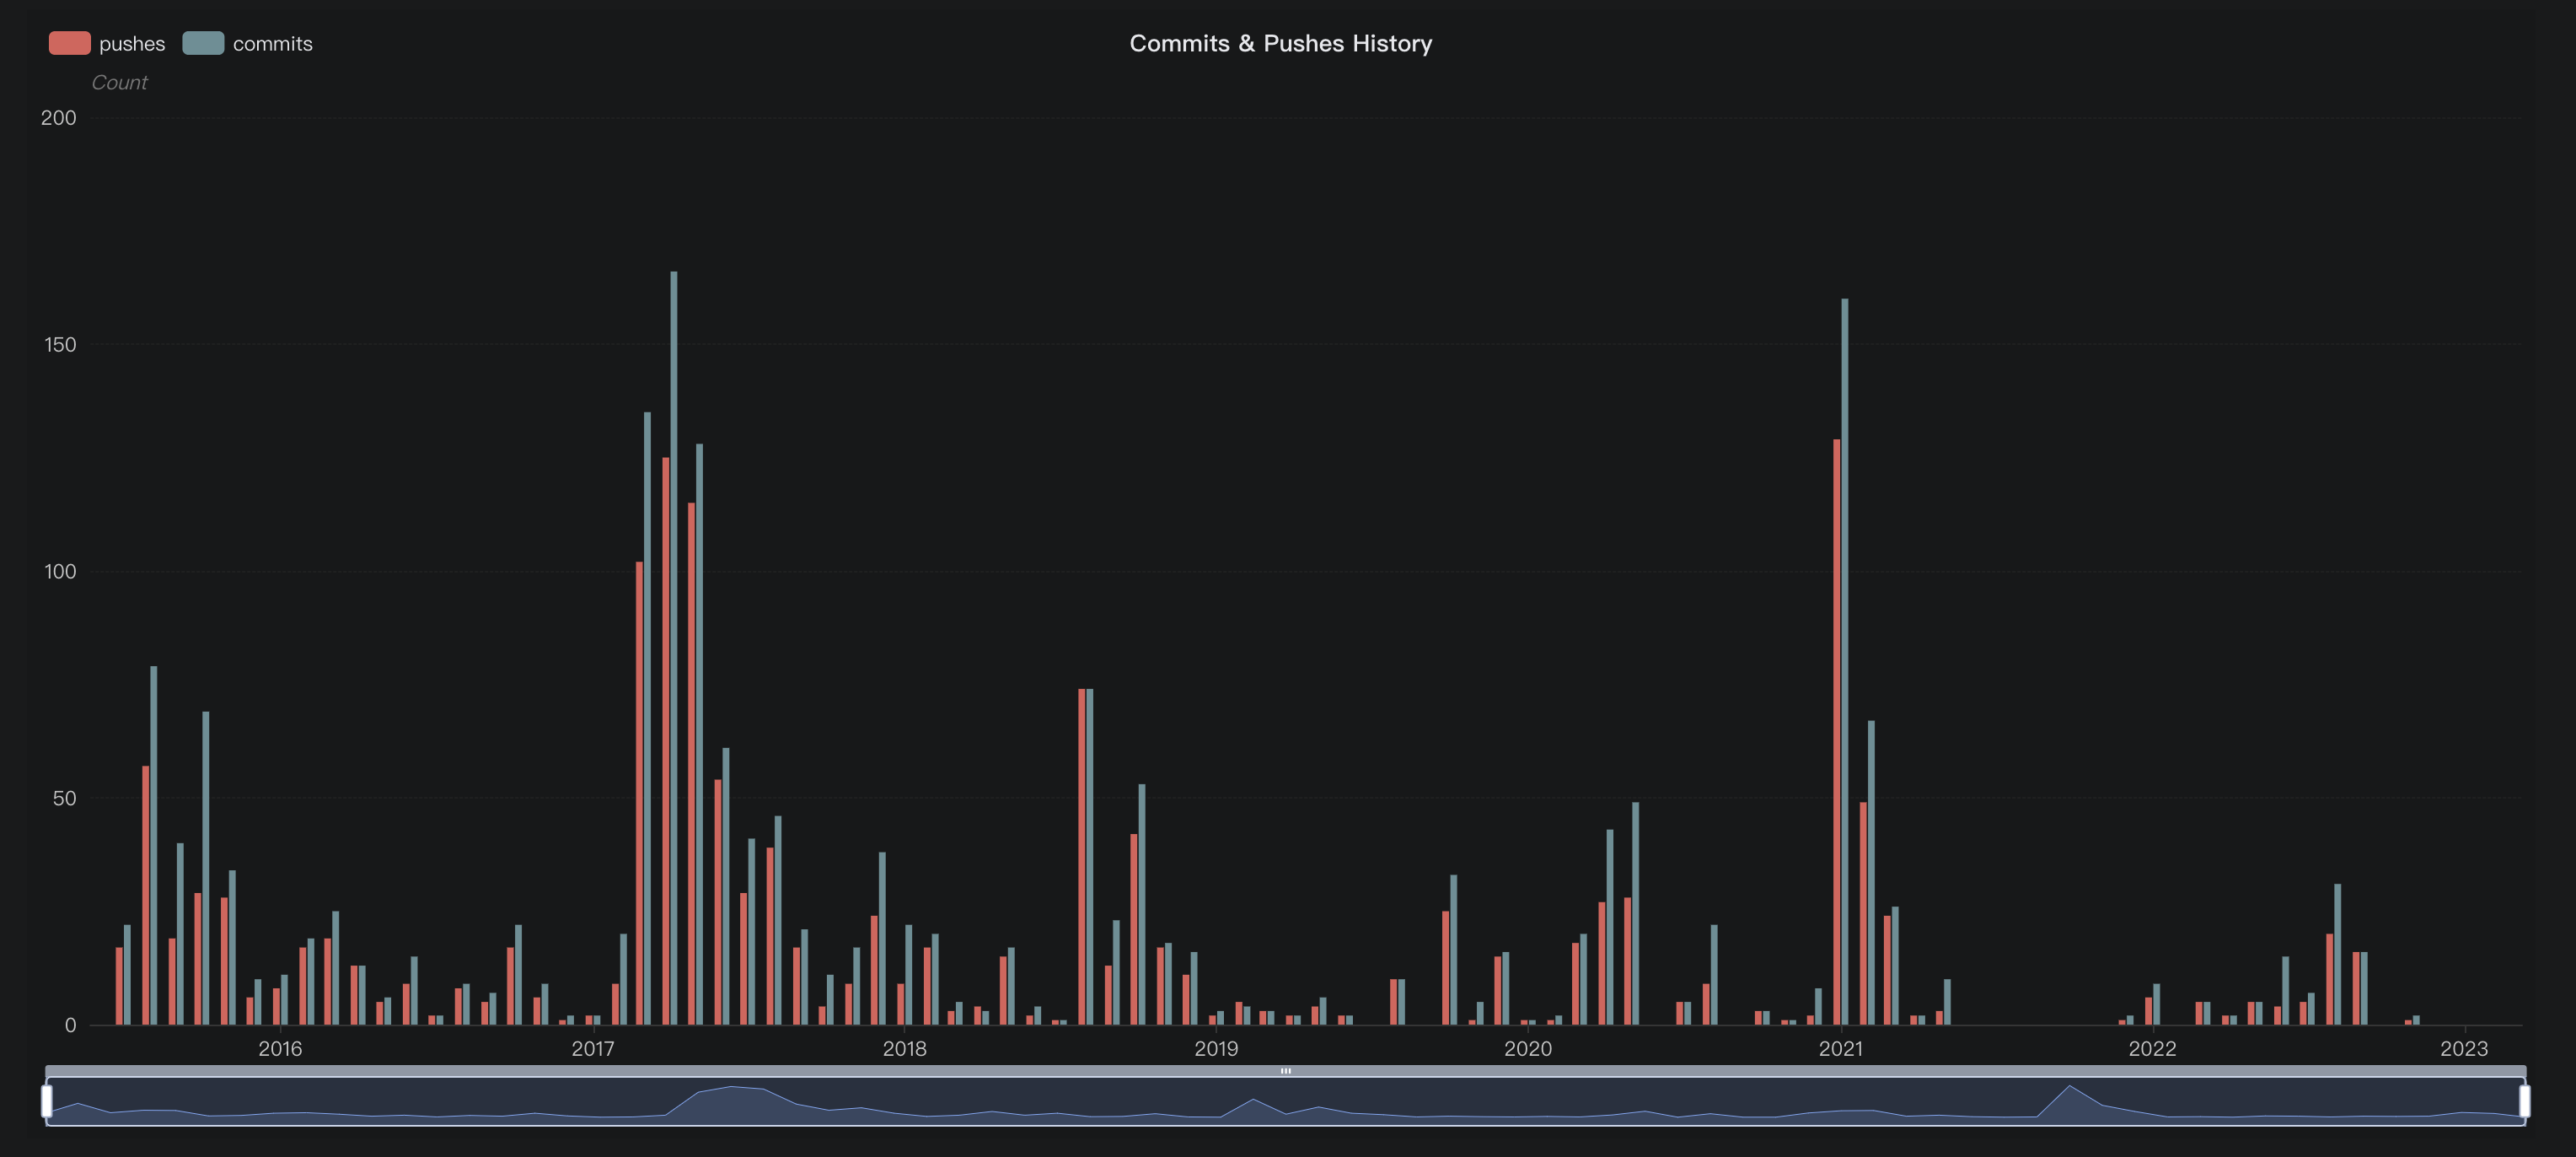
mycli-commit
MyCLI's commit history

However, with the popularity of cloud databases, such projects have fallen behind the times, so the updates for the project have been very slow.

Homebrew

Homebrew is a popular package manager for macOS that allows users to easily install and manage a wide variety of software packages. Homebrew is a nonprofit project run entirely by unpaid volunteer developers, with the lead maintainer being Mike McQuaid.


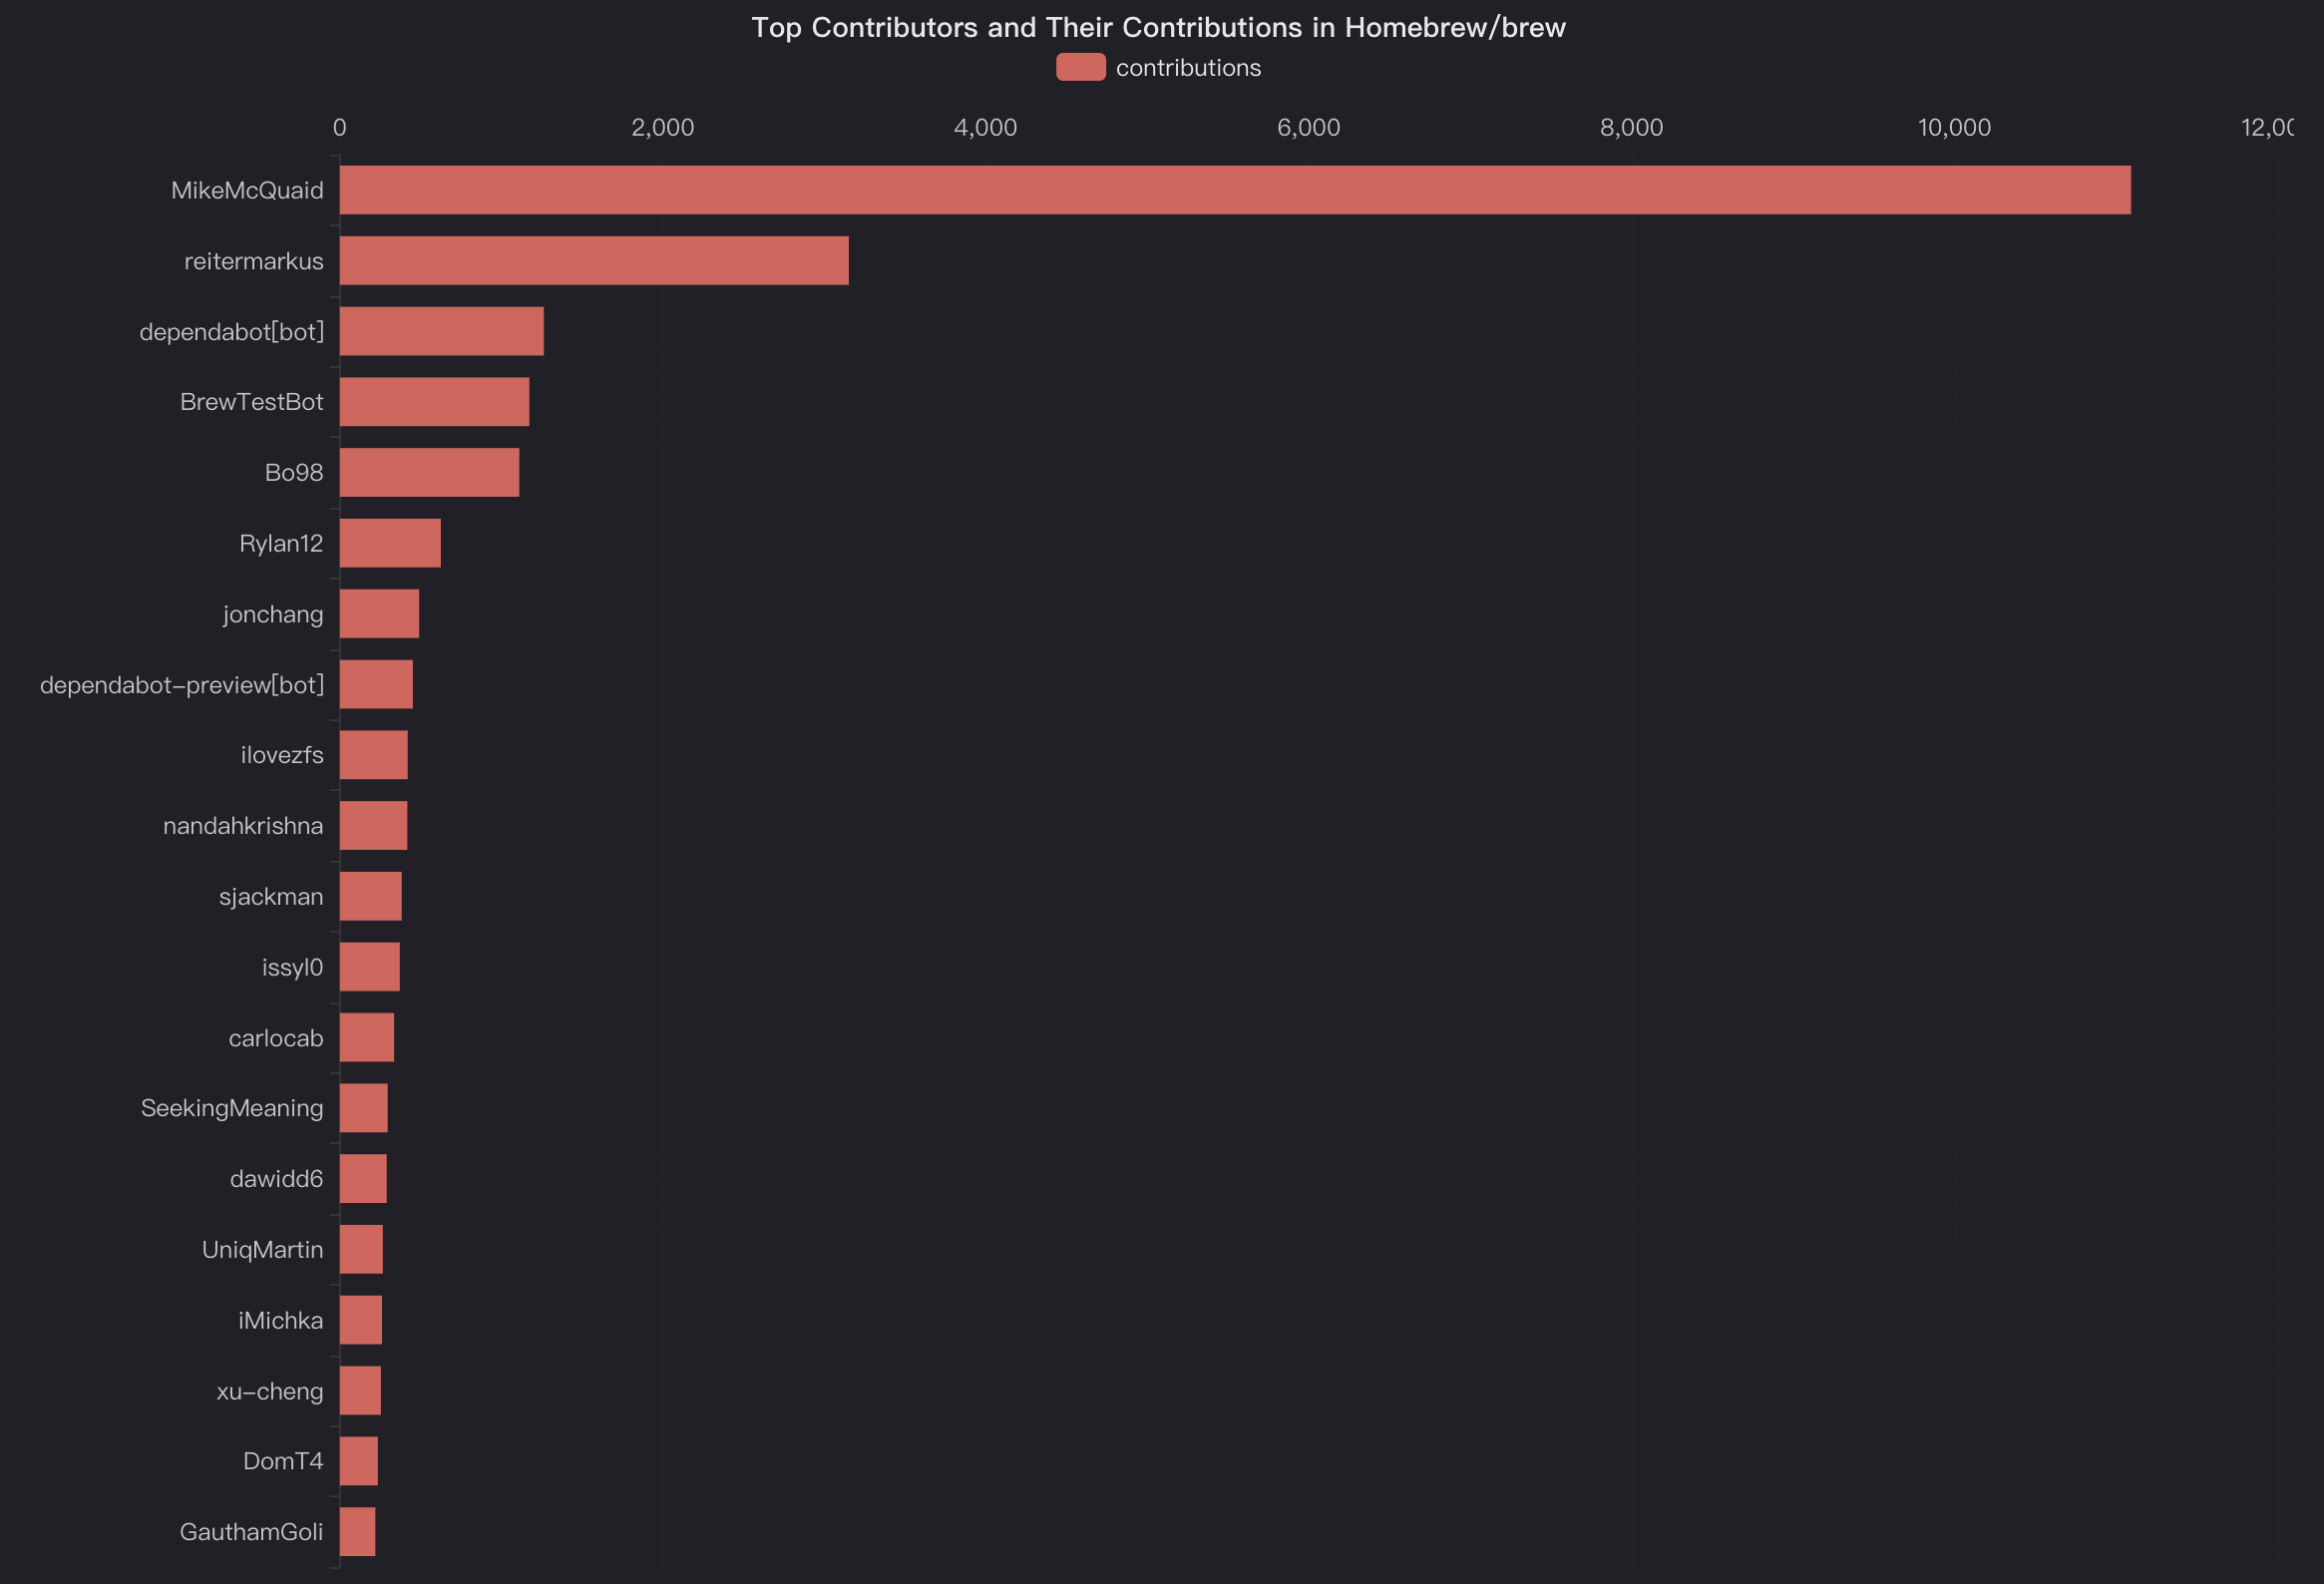
homebrew-contributor
Homebrew's top contributors

McQuaid has been involved with the Homebrew project since its inception and has been the lead maintainer since 2012—and he has full-time work on GitHub as a principal engineer.

Homebrew’s financial operations are managed by the Open Source Collective, and accepts donations through GitHub Sponsors, Open Collective or Patreon. Homebrew is also sponsoring some projects, including cURL mentioned earlier.

Apache Log4j

Apache Log4j is a powerful logging framework for Java that allows developers to log messages from their applications with fine-grained control over where and how those messages are recorded. This library has been widely adopted by Java developers and is used by many popular Java-based applications, including Apache Kafka and Apache Spark.


log4j2-stars
Apache Log4j's star history

Interestingly, the project did not receive much attention until November 2021, when a security vulnerability was reported. This incident doubled its star count and gained attention from the industry.


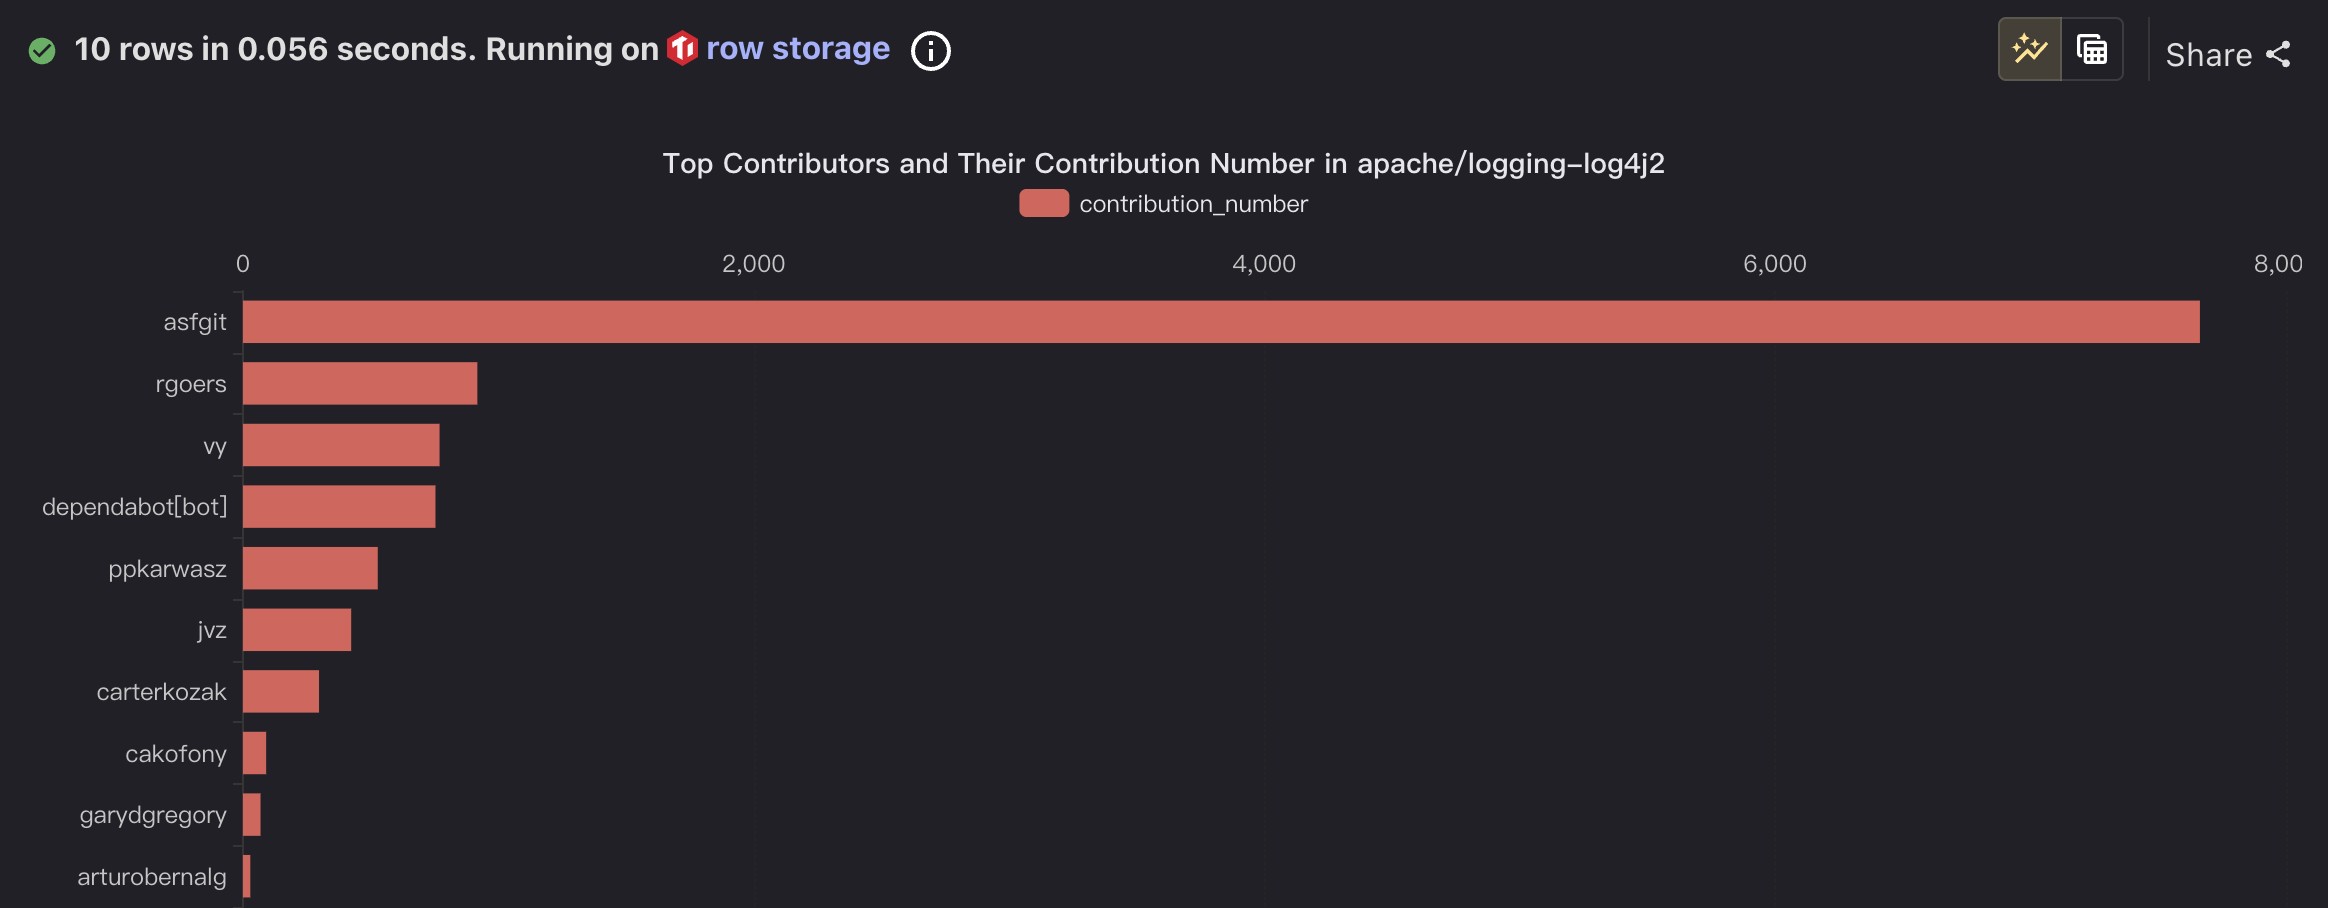
log4j2-contributor
Apache Log4j's top contributors

Ralph Goers is the original author of Log4j 2. He worked on the initial design and development of Log4j 2, which was released in 2014. Now he is working on Nextiva as a Fellow Architect.Now the core maintainer of logging-log4j2 is Gary Gregory, who is a member of the Apache Software Foundation and has been working on the project for over a decade.

Because the Log4j 2 project is under the Apache Foundation, the maintainers can focus more on project maintenance without worrying about financial issues.

OpenSSL

OpenSSL is an open source library that provides cryptographic functions for many different applications, including web servers, email clients, and virtual private networks. OpenSSL is used by millions of websites and applications to secure communications over the internet, including popular web servers like Apache and Nginx, as well as popular programming languages like Python and Ruby.


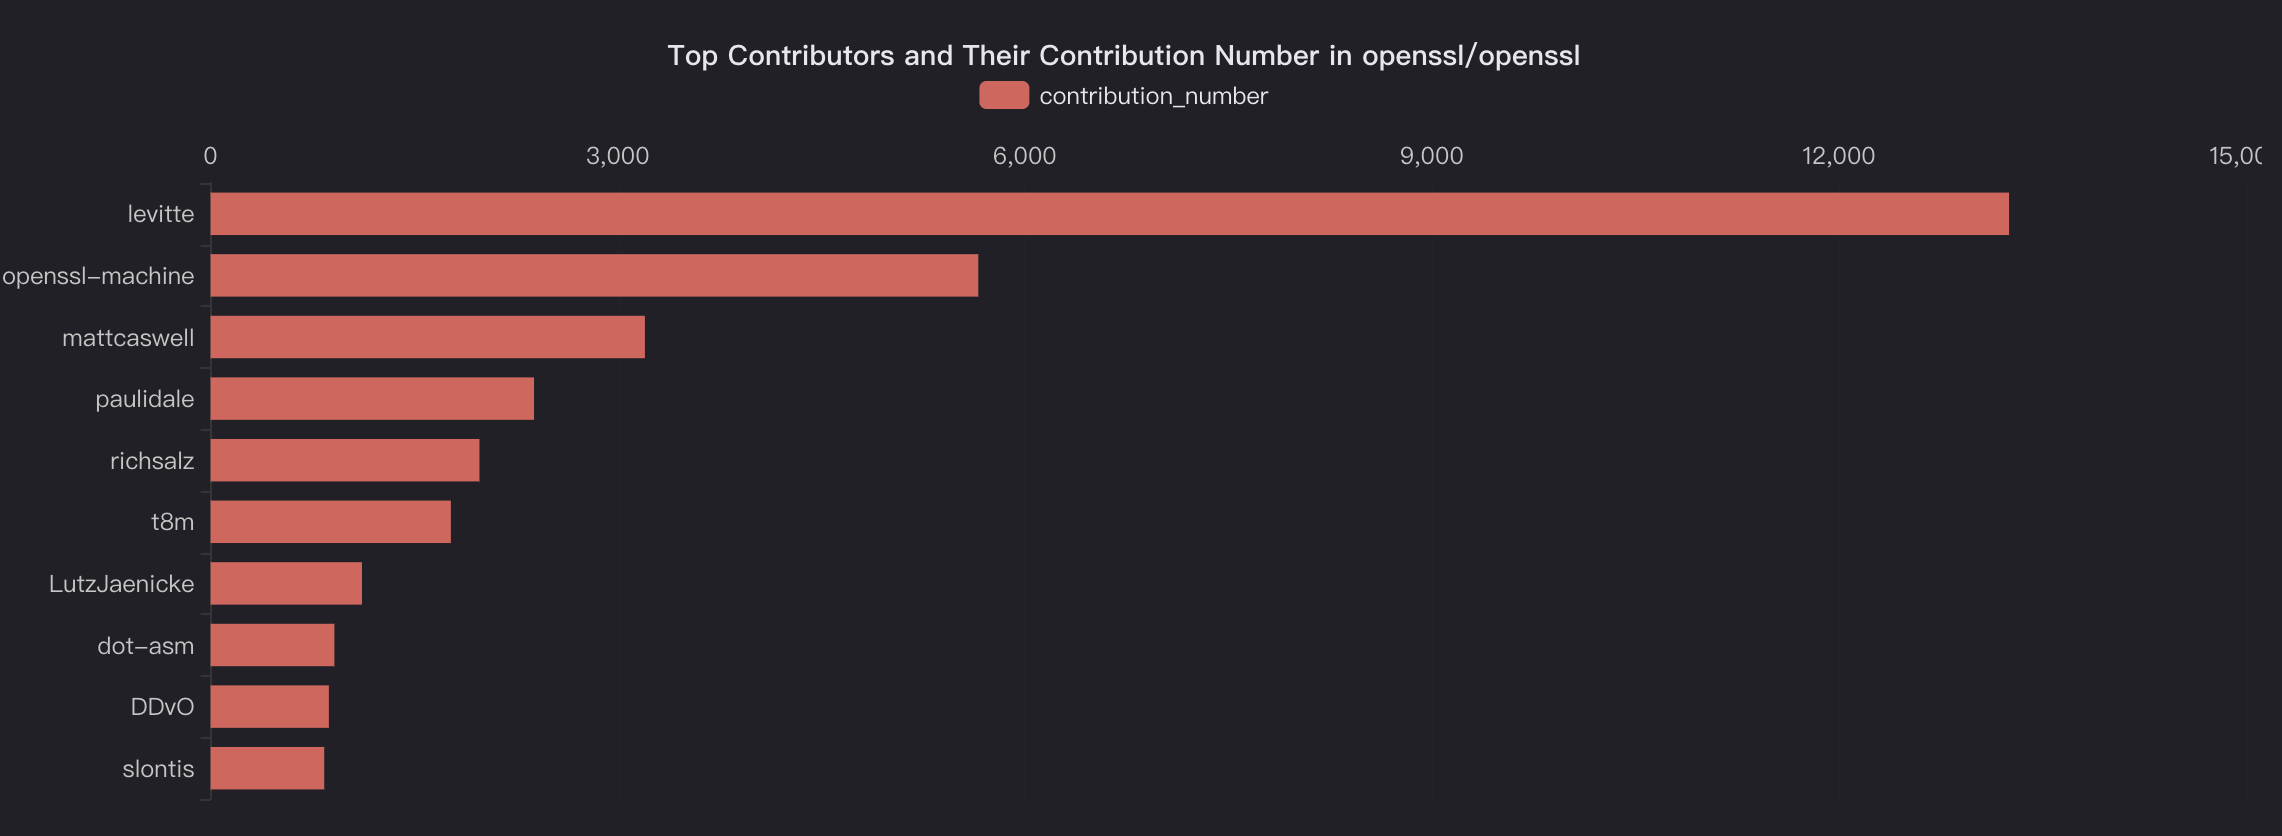
openssl-contributor
OpenSSL's top contributors

The project is developed by a distributed team, mostly consisting of volunteers with some project funded resources. The team is led by Matt Caswell, who has been working on OpenSSL since 2010 and became one of the maintainers in 2013.

Apart from volunteer developers, OpenSSL also depends on financial support from the community, which can be given in various forms. These include a support contract, a sponsorship donation, or a smaller donation via GitHub Sponsors.

Maintaining an open source project is no easy feat. It's a labor of love, built by passionate developers who sacrifice their time to create something that makes a difference. As users, we owe them our gratitude for the tools and technologies they provide. As Mike McQuaid suggested on the blog Open Source Maintainers Owe You Nothing, "Remember when filing an issue, opening a pull request, or making a comment on a project, to be grateful that people spend their free time to build software you get to use for free."

· One min read
PingCAP
ChatGPT

This blog is written with help of ChatGPT.


To get insight of your own dataset without writing sql is easy, follow these steps:

  1. Sign up for a TiDB Cloud account at https://tidbcloud.com/ using your email, Google account, or GitHub account.
  2. Create a free Serverless Tier cluster in the TiDB Cloud web console.

  3. In the TiDB Cloud web console, click the "Import" button and follow the prompts to load a CSV file into your cluster from a local file or from Amazon S3.

    Import Data

  4. Use the web console's SQL editor(Chat2Query) to get insights from your data. But no worry, you don't need to write SQL, you could ask questions about your data in natural language.

    The magic is typing -- your question and press Enter, here is an example:

· 11 min read
Mini256
Caitin Chen

TL;DR:

This post tells how a website on a distributed database reduced online serving latency from 1.11 s to 417.7 ms, and then to 123.6 ms. We found that some lessons learned on MySQL could be applied throughout the optimization process. But when we optimize a distributed database, we need to consider more.

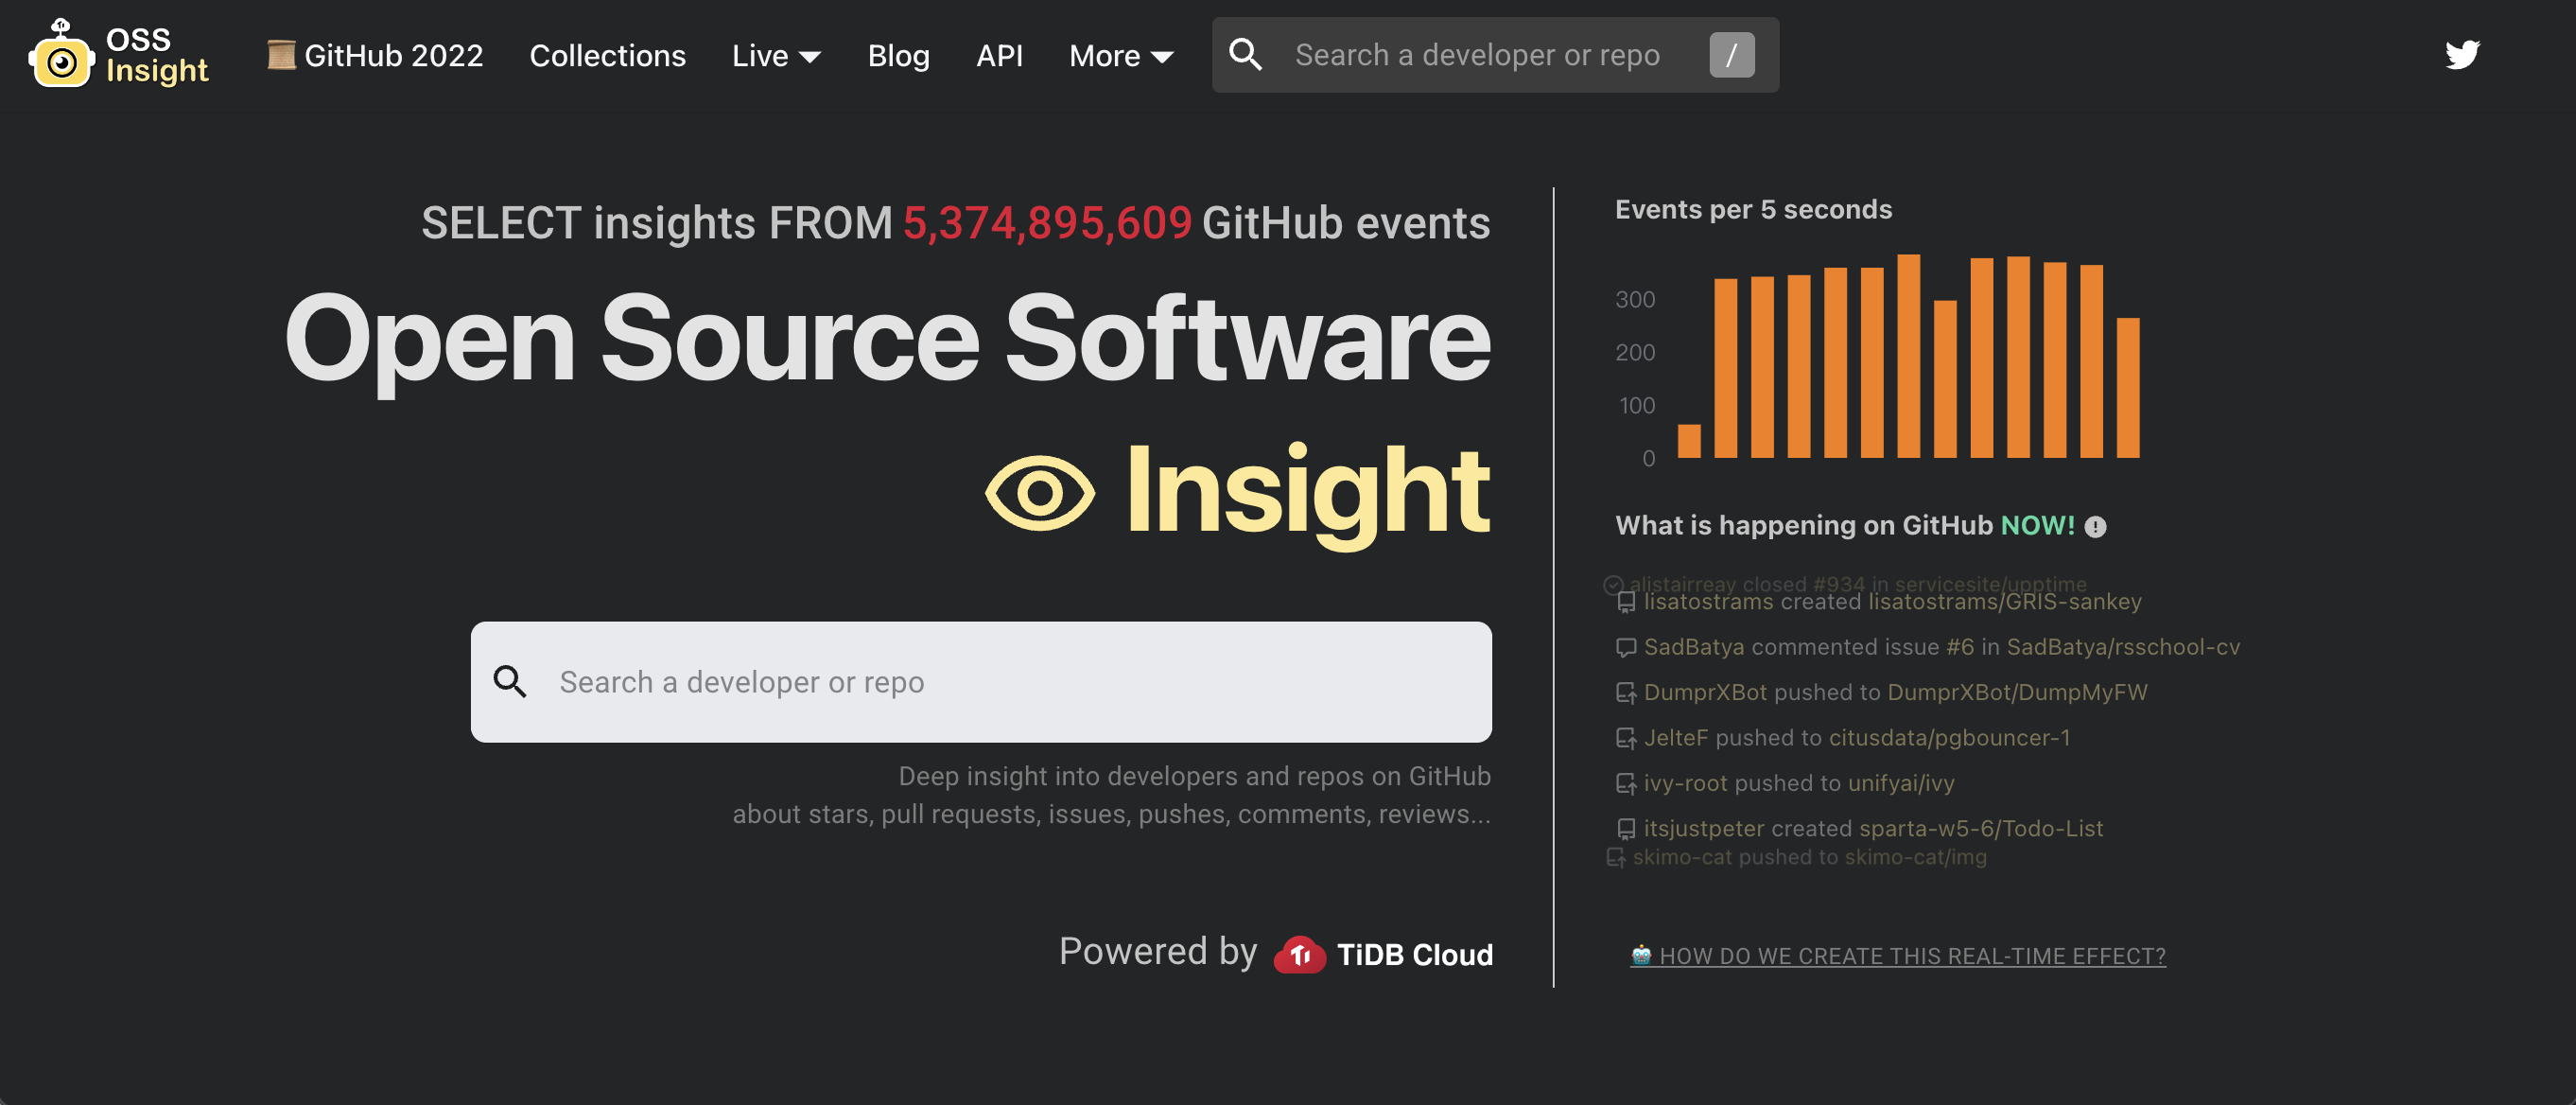
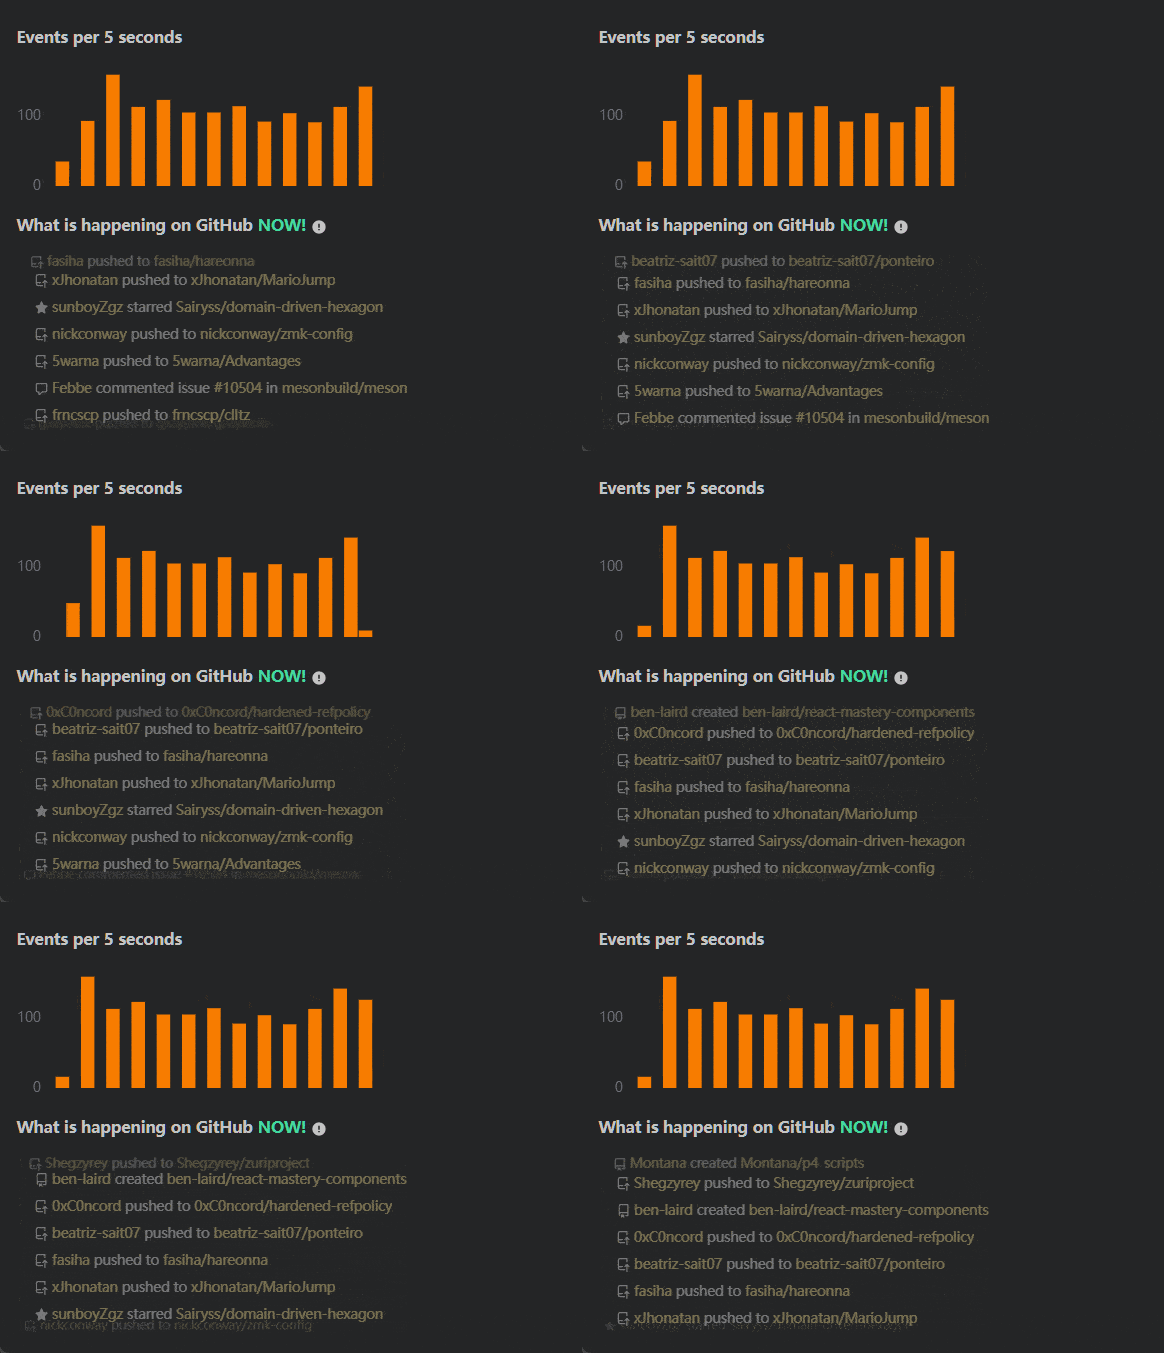
The OSS Insight website displays the data changes of GitHub events in real time. It's powered by TiDB Cloud, a MySQL-compatible distributed SQL database for elastic scale and real-time analytics.

Recently, to save costs, we tried to use lower-specification machines without affecting query efficiency and user experience. But our website and query response slowed down.


The repository analysis page was loading

The repository analysis page was loading, loading, and loading

How could we solve these problems on a distributed database? Could we use the methodology we learned on MySQL?

Analyzing the SQL execution plan

To identify slow SQL statements, we used TiDB Cloud's Diagnosis page to sort SQL queries by their average latency.

For example, after the API server received a request, it executed the following SQL statement to obtain the number of issues in the vscode repository:

SELECT
COUNT(DISTINCT number)
FROM github_events
WHERE
repo_id = 41881900 -- vscode
AND type = 'IssuesEvent';

However, if the open source repository is large, this query may take several seconds or more to execute.

Using EXPLAIN ANALYZE to troubleshoot query performance problems

In MySQL, when we troubleshoot query performance problems, we usually use the EXPLAIN ANALYZE <sql> statement to view the SQL statement's execution plan. We can use the execution plan to locate the problem. The same works for TiDB.

We executed the EXPLAIN statement:

EXPLAIN ANALYZE SELECT
COUNT(DISTINCT number)
FROM github_events
WHERE
repo_id = 41881900 -- vscode
AND type = 'IssuesEvent';

The result showed that the query took 1.11 seconds to execute.


The query result

The query result

You can see that TiDB's EXPLAIN ANALYZE statement execution result was completely different from MySQL's. TiDB's execution plan gave us a clearer understanding of how this SQL statement was executed.

The execution plan shows:

  • This SQL statement was split into several subtasks. Some were on the root node, and others were on the tikv node.
  • The query fetched data from the partition:issue_event partition table.
  • This query did a range scan through the index index_github_events_on_repo_id(repo_id). This let the query narrow down the data scan quickly. This process only took 59 ms. It was the sum of the execution times of multiple concurrent tasks.
  • Besides IndexRangeScan, the query also used TableRowIDScan. This scan took 4.69 s, the sum of execution times for multiple concurrent subtasks.

From the execution times above, we determined that the query performance bottleneck was in the TableRowIDScan step.

We reran the EXPLAIN ANALYZE statement and found that the query was faster the second time. Why?

Why did TableRowIDScan take so long?

To find the reason why TableRowIDScan took so long, we need basic knowledge of TiDB's underlying storage.

In TiDB, a table's data entries and indexes are stored on TiKV nodes in key-value pairs.

  • For an index, the key is the combination of the index value and the row_id (for a non-clustered index) or the primary key (for a clustered index). The row_id or primary key indicates where the data is stored.
  • For a data entry, the key is the combination of the table ID and the row_id or primary key. The value part is the combination of this row of data.

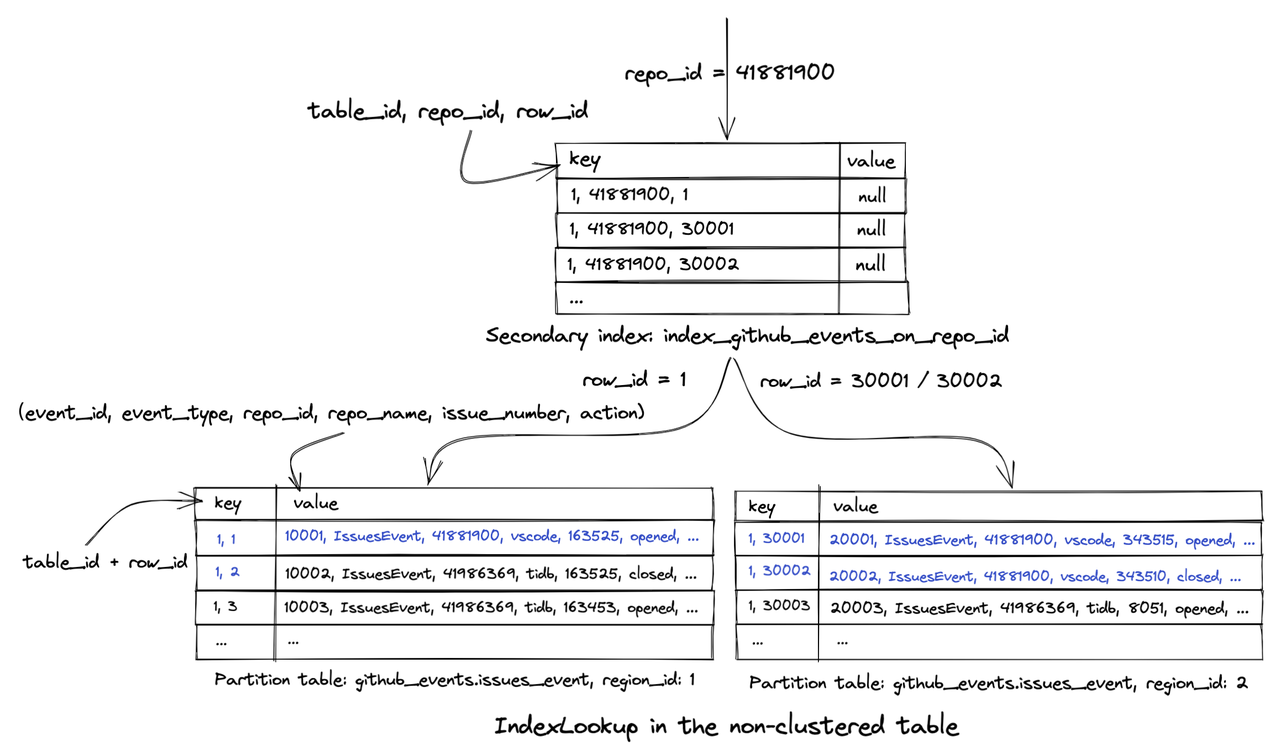
This graph shows how IndexLookup is executed in the execution plan:


The logical structure

This is the logical structure, not the physical storage structure.

In the query above, TiDB uses the query condition repo_id=41881900 to filter out all row numbers row_id related to the repository in the secondary index index_github_events_on_repo_id. The query needs the number column data, but the secondary index doesn't provide it. Therefore, TiDB must execute IndexLookup to find the corresponding row in the table based on the obtained row_id (the TableRowIDScan step).

The rows are probably scattered in different data blocks and stored on the hard disk. This causes TiDB to perform a large number of I/O operations to read data from different data blocks or even different machine nodes.

Why was EXPLAIN ANALYZE faster the second time?

In EXPLAIN ANALYZE's execution result, we saw that the "execution info" column corresponding to the TableRowIDScan step contained this information:

block: {cache_hit_count: 2755559, read_count: 179510, read_byte: 4.07 GB}

We thought this had something to do with TiKV. TiKV read a very large number of data blocks from the disk. Because the data blocks read from the disk were cached in memory in the first execution, 2.75 million data blocks could be read directly from memory instead of being retrieved from the hard disk. This made the TableRowIDScan step much faster, and the query was faster overall.

However, we believed that user queries were random. For example, a user might look up data from a vscode repository and then go to a kubernetes repository. TiKV's memory couldn't cache all the data blocks in all the drives. Therefore, this did not solve our problem, but it reminded us that when we analyze SQL execution efficiency, we need to exclude cache effects.

Using a covering index to avoid executing TableRowIDScan

Could we avoid executing TableRowIDScan in IndexLookup?

In MySQL, a covering index prevents the database from index lookup after index filtering. We wanted to apply this to OSS Insight. In our TiDB database, we tried to create a composite index to achieve index coverage.

When we created a composite index with multiple columns, we needed to pay attention to the column order. Our goals were to allow a composite index to be used by as many queries as possible, to help these queries narrow the scope of data scans as quickly as possible, and to provide as many fields as possible in the query. When we created a composite index we followed this order:

  1. Columns that had high differentiation and could be used as equivalence conditions for the WHERE statement, like repo_id
  2. Columns that didn't have high differentiation but could be used as equivalence conditions for the WHERE statement, like type and action
  3. Columns that could be used as range query conditions for the WHERE statement, like created_at
  4. Redundant columns that were not used as filter conditions but were used in the query, such as number and push_size

We used the CREATE INDEX statement to create a composite index in the database:

CREATE INDEX index_github_events_on_repo_id_type_number ON github_events(repo_id, type, number);

When we created the index and ran the SQL statement again, the query speed was significantly faster. We viewed the execution plan through EXPLAIN ANALYZE and found that the execution plan became simpler. The IndexLookup and TableRowIDScan steps were gone. The query took only 417.7 ms.


The result of the EXPLAIN query

The result of the EXPLAIN query. This query cost 417.7 ms

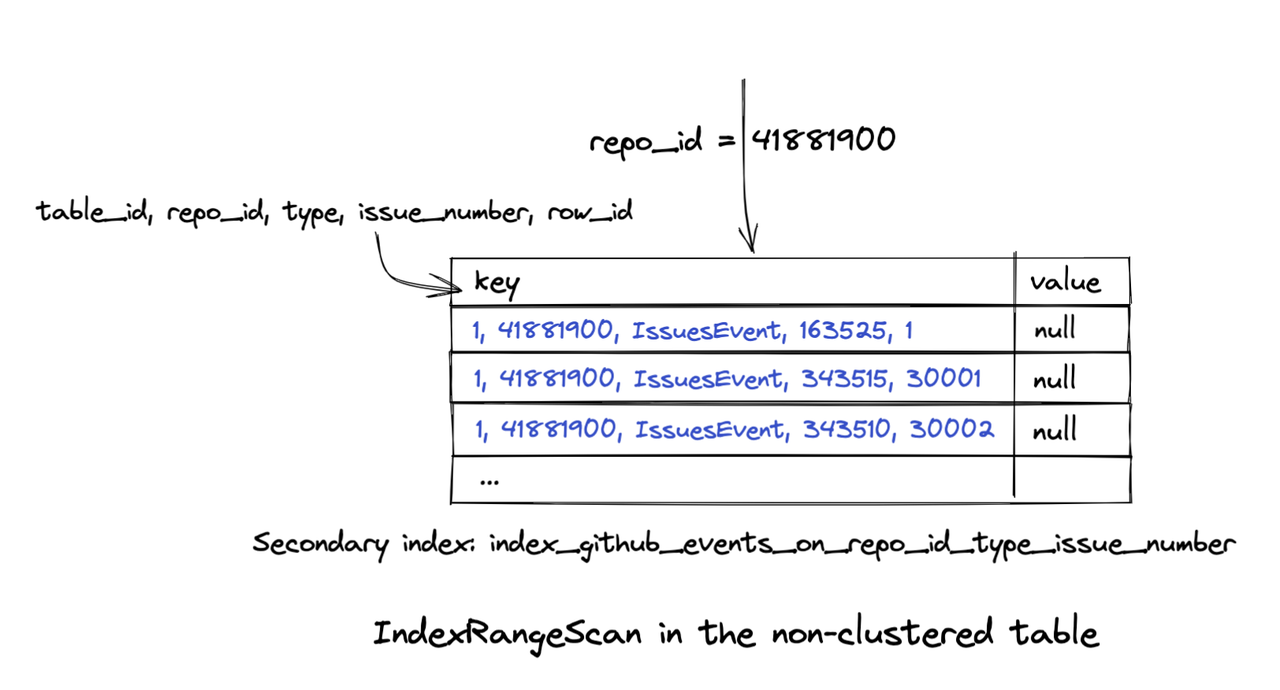
So we knew that our query could get all the data it needed by doing an IndexRangeScan on the new index. This composite index included the number field, so TiDB did not need to perform IndexLookup to get data from the table. This reduced a lot of I/O operations.


`IndexRangeScan` in the non-clustered table

IndexRangeScan in the non-clustered table

Pushing down computing to further reduce query latency

For a query that needed to obtain 270,000 rows of data, 417.7 ms was quite a short execution time. But could we improve the time even more?

We thought this relied on TiDB's architecture that separates computing and storage layers. This is different from MySQL.

In TiDB:

  • The tidb-server node computes data. It corresponds to root in the execution plan.
  • The tikv-server node stores the data. It corresponds to cop[tikv] in the execution plan.

Generally, an SQL statement is split into multiple steps to execute with the cooperation of computing and storage nodes.

When we executed the SQL statement in this article, TiDB obtained the data of the github_events table from tikv-server and performed the aggregate calculation of the COUNT function on tidb-server.

SELECT
COUNT(DISTINCT number)
FROM github_events
WHERE
repo_id = 41881900 -- vscode
AND type = 'IssuesEvent';

The execution plan indicated that when TiDB was performing IndexReader, tidb-server needed to read 270,000 rows of data from tikv-server through the network. This was time-consuming.


`tidb-server` read 270,000 rows of data from `tikv-server`

tidb-server read 270,000 rows of data from tikv-server

How could we avoid such a large network transmission? Although the query needed to obtain a large amount of data, the final calculation result was only a number. Could we complete the COUNT aggregation calculation on tikv-server and return the result only to tidb-server?

TiDB had implemented this idea through the coprocessor on tikv-server. This optimization process is called computing pushdown.

The execution plan indicated that our SQL query did not do this. Why? We checked the TiDB documentation and learned that:

Usually, aggregate functions with the DISTINCT option are executed in the TiDB layer in a single-threaded execution model.

This meant that our SQL statement couldn't use computing pushdown.

SELECT
COUNT(DISTINCT number)
FROM github_events
WHERE
repo_id = 41881900 -- vscode
AND type = 'IssuesEvent';

Therefore, we removed the DISTINCT keyword.

For the github_events table, an issue only generated an event with the IssuesEvent type and opened action. We could get the total number of unique issues by adding the condition of action = 'opened'. This way, we didn't need to use the DISTINCT keyword for deduplication.

SELECT
COUNT(number)
FROM github_events
WHERE
repo_id = 41881900 -- vscode
AND type = 'IssuesEvent'
AND action = 'opened';

The composite index we created lacked the action column. This caused the query index coverage to fail. So we created a new composite index:

CREATE INDEX index_github_events_on_repo_id_type_action_number ON github_events(repo_id, type, action, number);

After we created the index, we checked the execution plan of the modified SQL statement through the EXPLAIN ANALYZE statement. We found that:

  • Because we added a new filter action='opened', the number of rows to scan had decreased from 270,000 to 140,000.
  • tikv-server executed the StreamAgg operator, which was the aggregate calculation of the COUNT function. This indicated that the calculation had been pushed down to the TiKV coprocessor for execution.
  • tidb-server only needed to obtain two rows of data from tikv-server through the network. This greatly reduced the amount of data transmitted.
  • The query only took 123.6 ms.
+-------------------------+---------+---------+-----------+-------------------------------------------------------------------------------------------------------------------------+--------------------------------------------------------------------------------------------------------------------------------------------------------------------------------------------------------------------------------------------------------------------------------------------------------------------------------------------------------------------------+-------------------------------------------------------------------------------------------+-----------+------+
| id | estRows | actRows | task | access object | execution info | operator info | memory | disk |
+-------------------------+---------+---------+-----------+-------------------------------------------------------------------------------------------------------------------------+--------------------------------------------------------------------------------------------------------------------------------------------------------------------------------------------------------------------------------------------------------------------------------------------------------------------------------------------------------------------------+-------------------------------------------------------------------------------------------+-----------+------+
| StreamAgg_28 | 1.00 | 1 | root | | time:123.6ms, loops:2 | funcs:count(Column#43)->Column#34 | 388 Bytes | N/A |
| └─IndexReader_29 | 1.00 | 2 | root | partition:issues_event | time:123.6ms, loops:2, cop_task: {num: 2, max: 123.5ms, min: 1.5ms, avg: 62.5ms, p95: 123.5ms, max_proc_keys: 131360, p95_proc_keys: 131360, tot_proc: 115ms, tot_wait: 1ms, rpc_num: 2, rpc_time: 125ms, copr_cache_hit_ratio: 0.50, distsql_concurrency: 15} | index:StreamAgg_11 | 590 Bytes | N/A |
| └─StreamAgg_11 | 1.00 | 2 | cop[tikv] | | tikv_task:{proc max:116ms, min:8ms, avg: 62ms, p80:116ms, p95:116ms, iters:139, tasks:2}, scan_detail: {total_process_keys: 131360, total_process_keys_size: 23603556, total_keys: 131564, get_snapshot_time: 1ms, rocksdb: {delete_skipped_count: 320, key_skipped_count: 131883, block: {cache_hit_count: 307, read_count: 1, read_byte: 63.9 KB, read_time: 60.2µs}}} | funcs:count(gharchive_dev.github_events.number)->Column#43 | N/A | N/A |
| └─IndexRangeScan_15 | 7.00 | 141179 | cop[tikv] | table:github_events, index:index_ge_on_repo_id_type_action_created_at_number(repo_id, type, action, created_at, number) | tikv_task:{proc max:116ms, min:8ms, avg: 62ms, p80:116ms, p95:116ms, iters:139, tasks:2} | range:[41881900 "IssuesEvent" "opened",41881900 "IssuesEvent" "opened"], keep order:false | N/A | N/A |
+-------------------------+---------+---------+-----------+-------------------------------------------------------------------------------------------------------------------------+--------------------------------------------------------------------------------------------------------------------------------------------------------------------------------------------------------------------------------------------------------------------------------------------------------------------------------------------------------------------------+-------------------------------------------------------------------------------------------+-----------+------+

Applying what we learned to other queries

Through our analysis and optimizations, the query latency was significantly reduced:

1.11 s → 417.7 ms → 123.6 ms

We applied what we learned to other queries and created the following composite indexes in the github_events table:

index_ge_on_repo_id_type_action_pr_merged_created_at_add_del

index_ge_on_repo_id_type_action_created_at_number_pdsize_psize

index_ge_on_repo_id_type_action_created_at_actor_login

index_ge_on_creator_id_type_action_merged_created_at_add_del

index_ge_on_actor_id_type_action_created_at_repo_id_commits

These composite indexes covered more than 20 analytical queries in repository analysis and personal analysis pages on the OSS Insight website. This improved our website's overall loading speed.

Some lessons we learned on MySQL can be applied throughout the optimization process. But we need to consider more when we optimize query performance in a distributed database. We also recommend you read Performance Tuning in the TiDB documentation. This will give you a more professional and comprehensive guide to performance optimization.

References

· 10 min read
Cheese Wong
Jagger
hooopo
Vita Lu
Mia Zhou
Caitin Chen

We analyzed more than 5,000,000,000 rows of GitHub event data and got the results here. In this report, you'll get interesting findings about open source software on GitHub in 2022, including:

Top languages in the open source world over the past four years

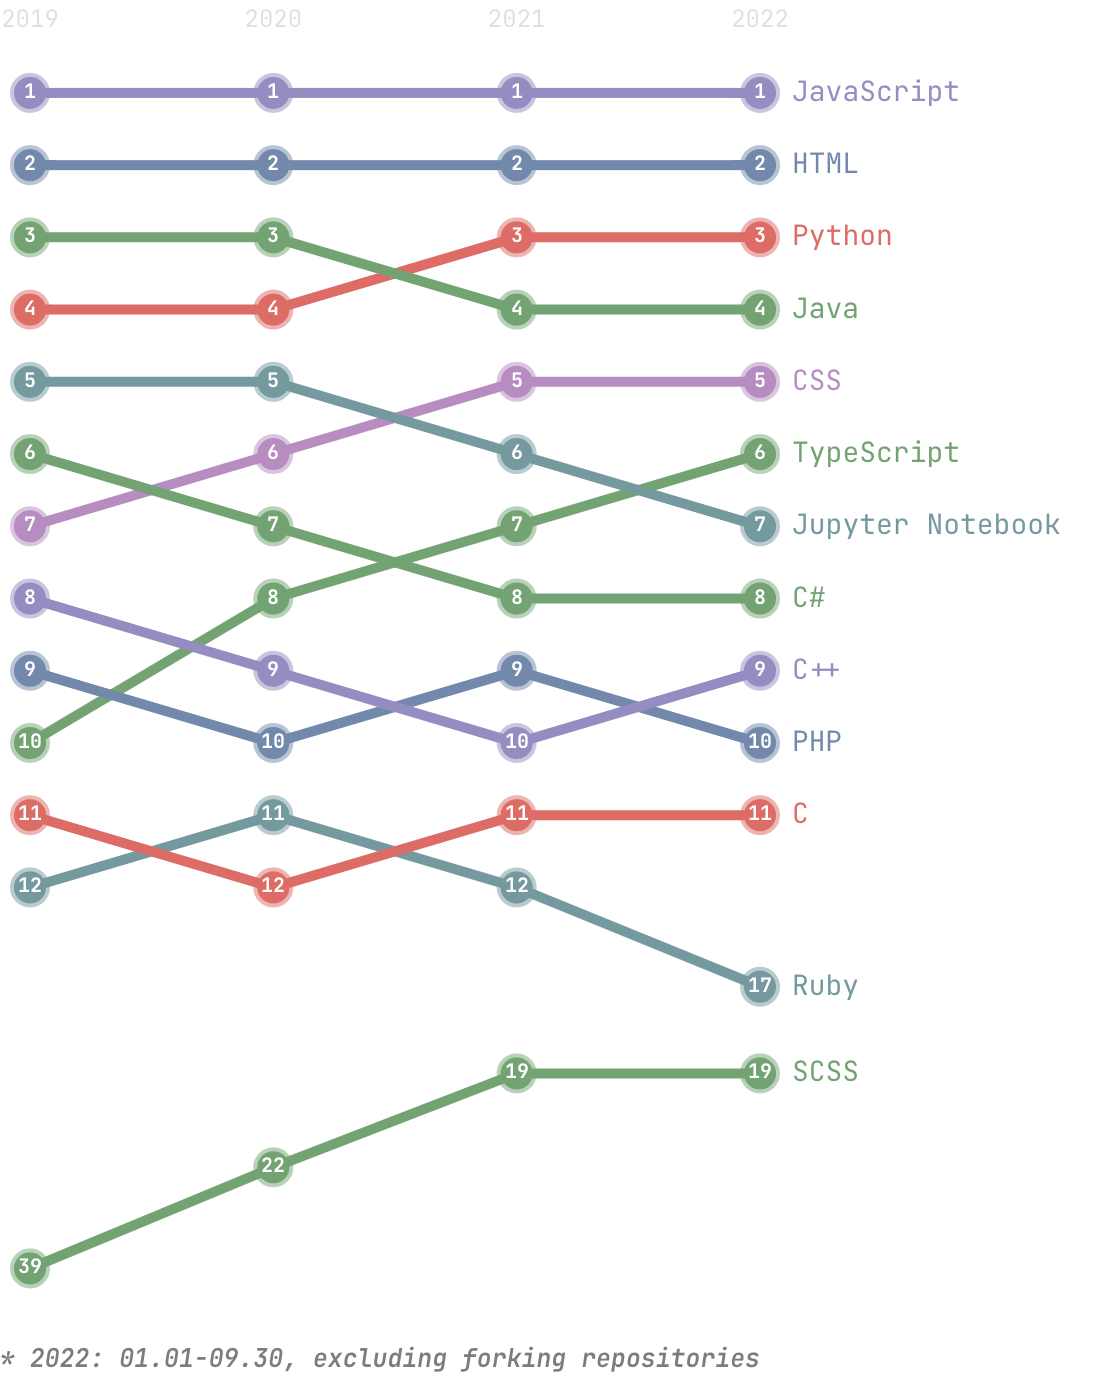
This chart ranks programming languages yearly from 2019 to 2022 based on the ratio of new repositories using these languages to all new repositories.


top-programming-languages
Top programming languages

Insights:

  • Python surpassed Java and moved to #3 in 2021.
  • TypeScript rose from #10 to #6, and SCSS rose from #39 to #19. The rise of SCSS shows that open source projects that value front-end expressiveness are gradually gaining popularity.
  • The two languages Ruby and R dropped a lot in ranking over the years.

Rankings of back-end programming languages

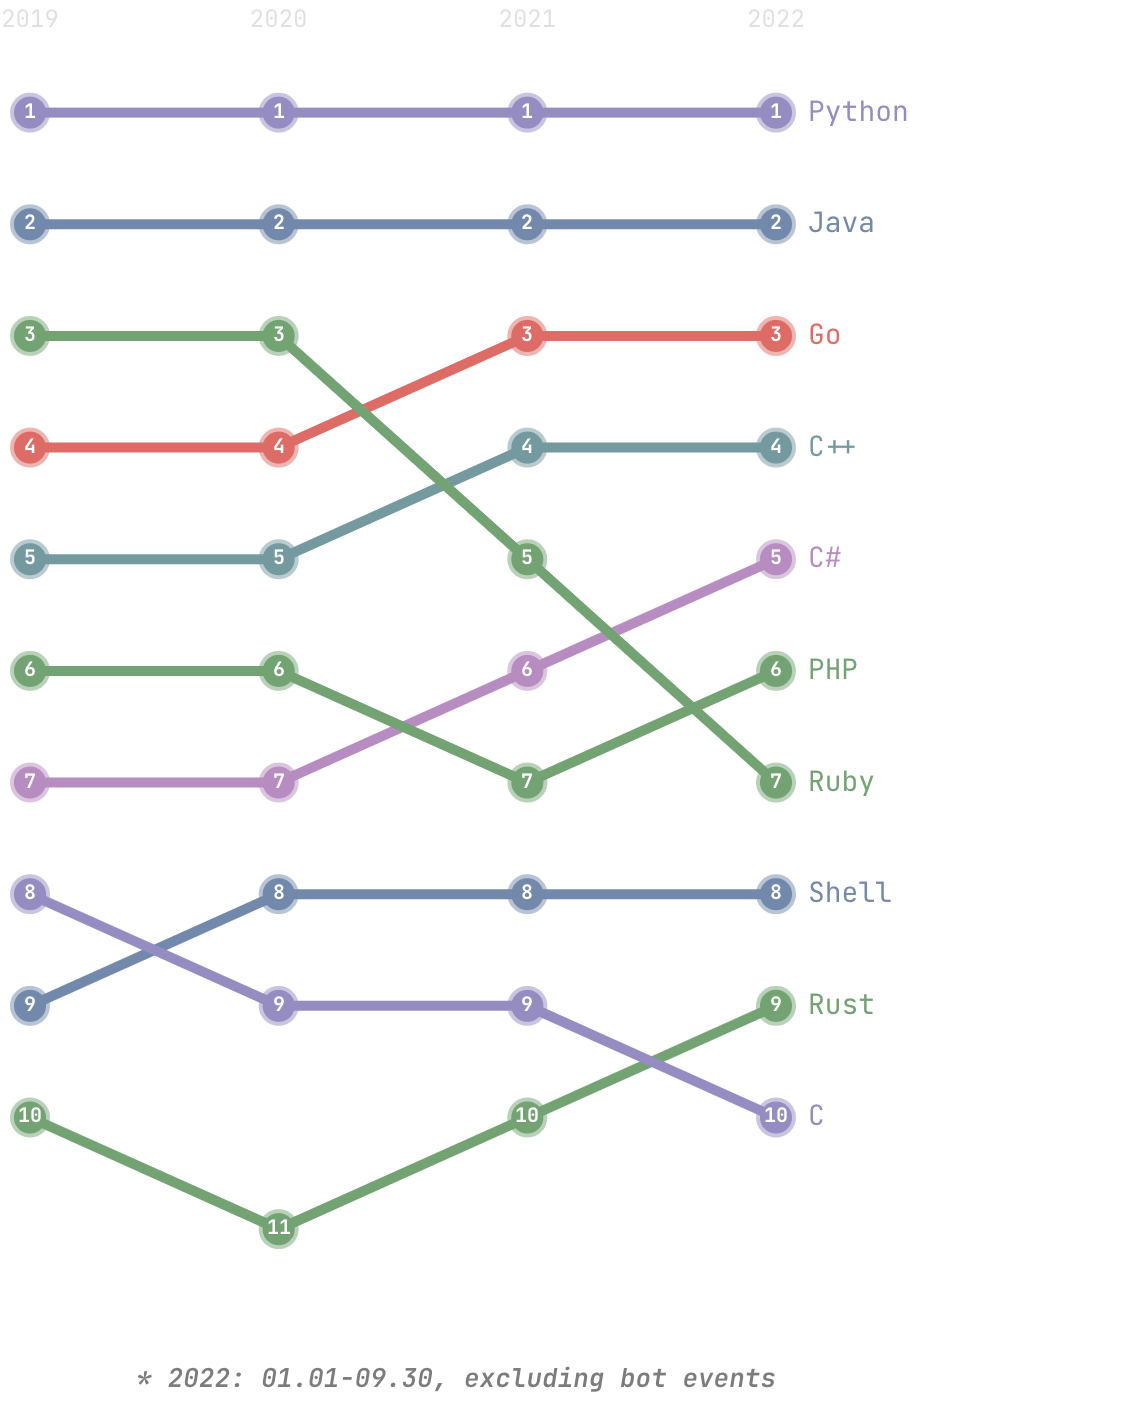
The programming languages used in a pull request reflect which languages developers used. To find out the most popular back-end programming languages, we queried the distribution of programming languages by new pull requests from 2019 to 2022 and took the top 10 for each year.


top-back-end-programming-languages
Top back-end programming languages

The chart data indicates:

  • Python and Java rank #1 and #2 respectively. In 2021, Go overtook Ruby to rank #3 in 2021.
  • Rust has been trending upward for several years, ranking #9 in 2022.

Geographic distribution of developer behavior

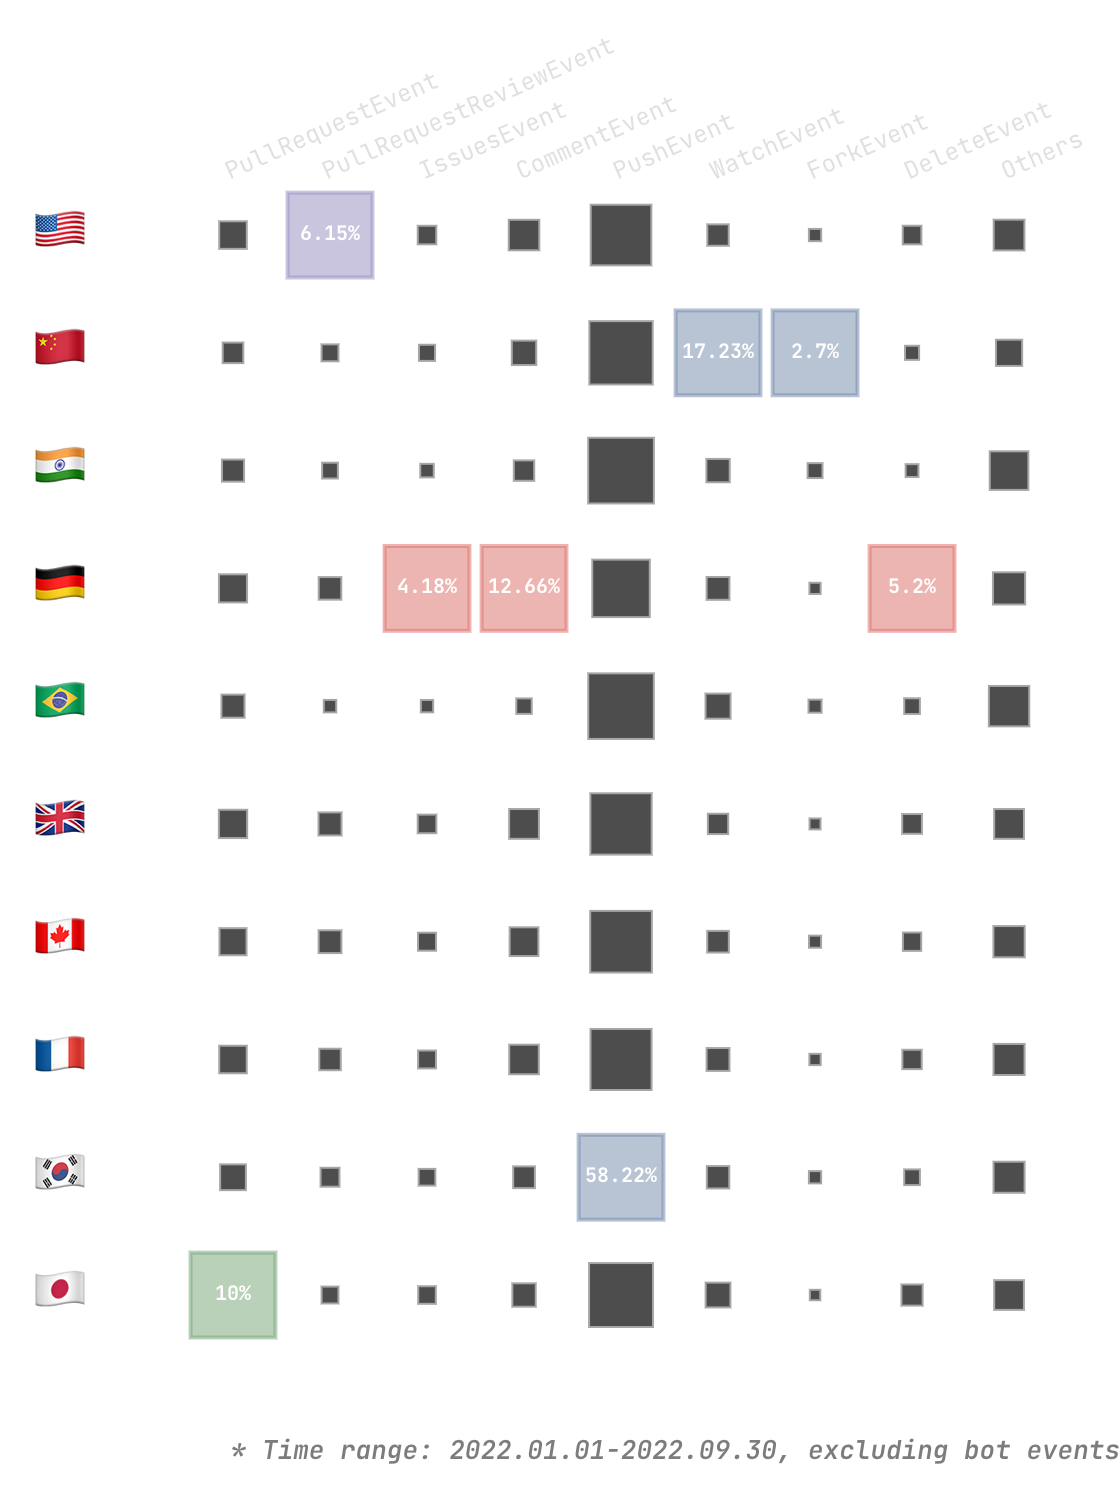
We queried the number of various events that occurred throughout the world from January 1 to September 30, 2022 and identified the top 10 countries by the number of events triggered by developers in these countries. The chart displays the proportion of each event type by country or region.


geographic-distribution-of-developer-behavior
Geographic distribution of developer behavior

The chart shows that:

  • The events triggered in the top 10 countries account for about 23.27% of all GitHub events. However, the number of developers from these countries is only 10%.
  • US developers are most likely to review code, with a PullRequestReviewEvent share of 6.15%.
  • Korean developers prefer pushing directly to repositories (PushEvent).
  • Japanese developers are most likely to submit code via pull requests, with a PullRequestEvent share of 10%.
  • German developers like to open issues and comments, with IssueEvent and CommentEvent accounting for 4.18% and 12.66% respectively.
  • Chinese developers like to star repositories, with 17.23% for WatchEvent and 2.7% for ForkEvent.

Notes:

  • In 2022, 17,062,081 developers had behavioral events, and 2,923,523 of them have the Location field, so the sampling rate is 17.13%
  • GitHub identifies 15 types of events. We only show commonly used types. Comment Event includes CommitCommentEvent, IssueCommentEvent, and PullRequestReviewCommentEvent. Others includes MemberEvent, CreateEvent, ReleaseEvent, GollumEvent, and PublicEvent.

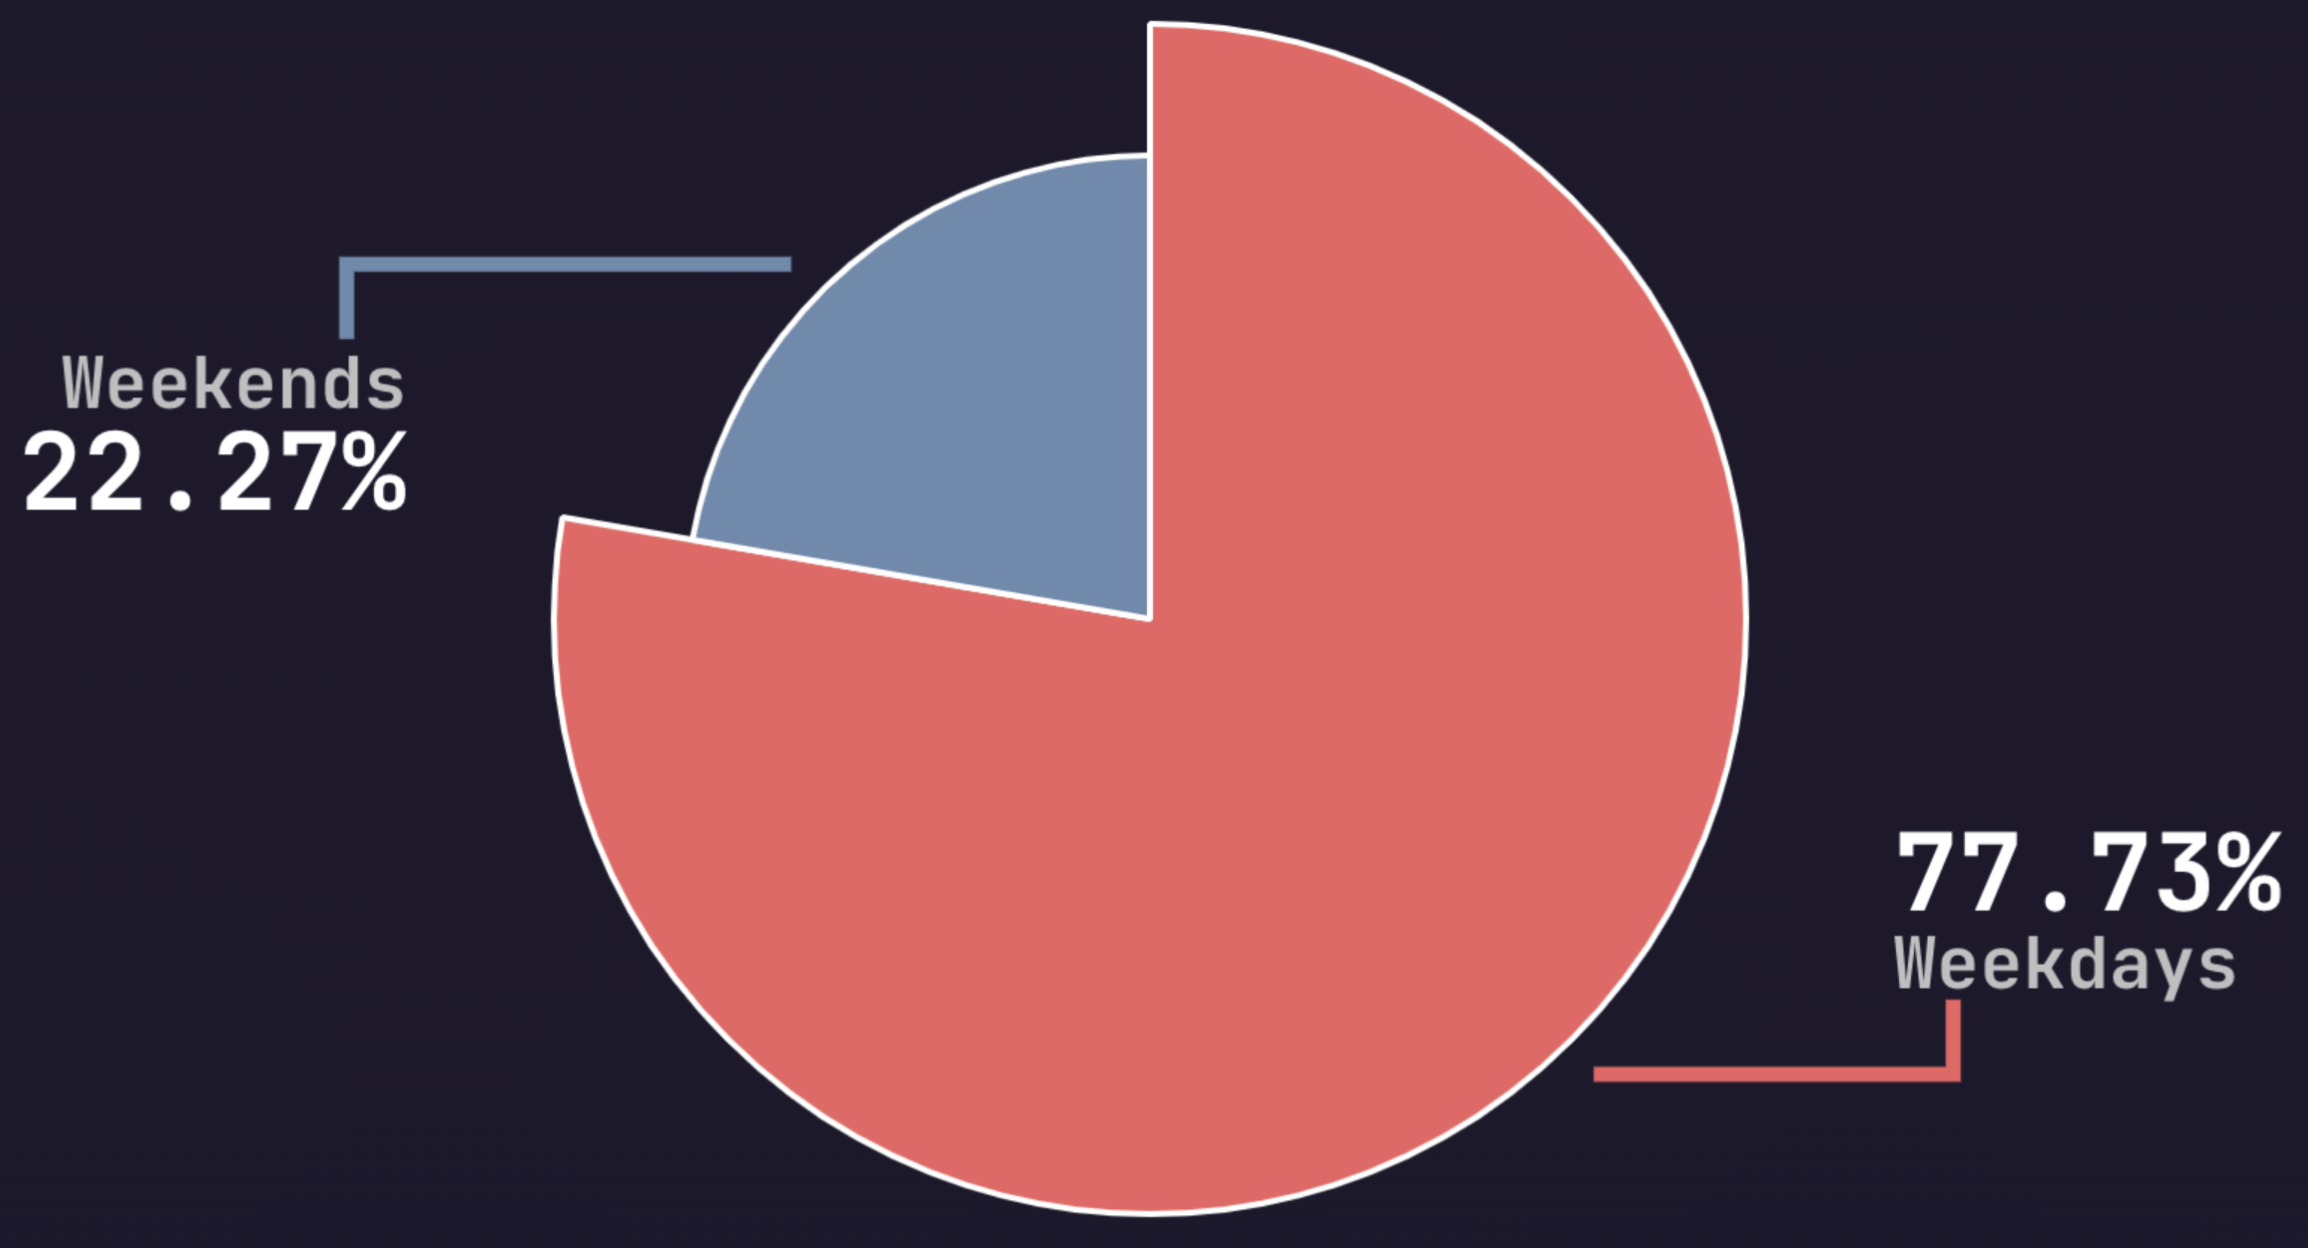
Developer behavior distribution on weekdays and weekends

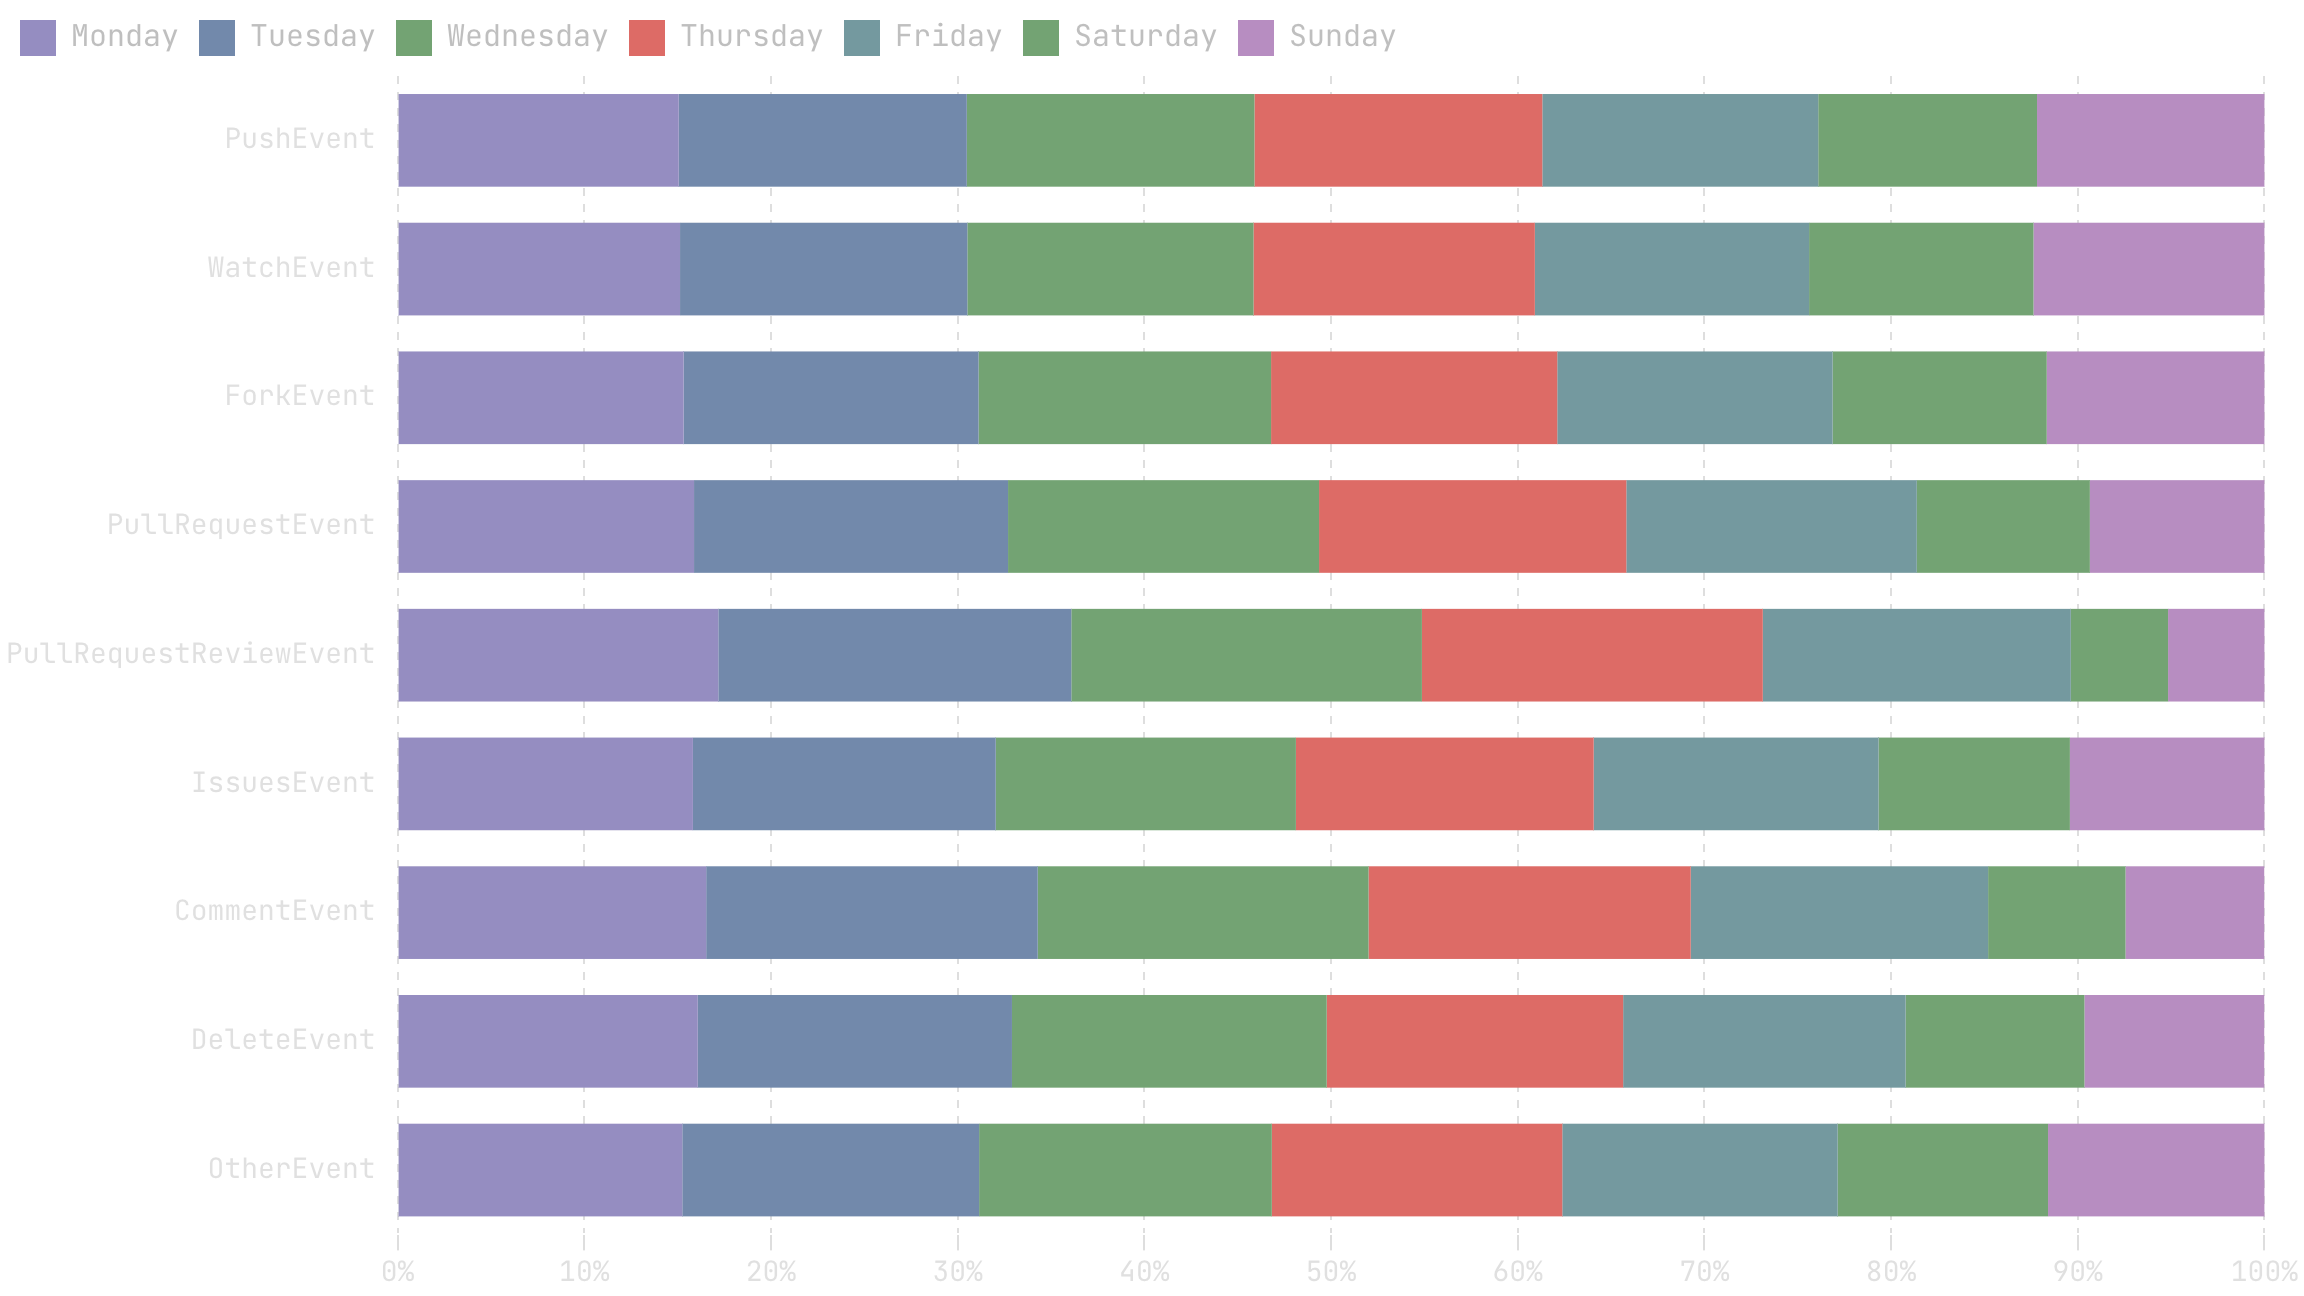
We queried the distribution of each event type over the seven days of the week.


developer-behavior-distribution-on-weekdays-and-weekends
Developer behavior distribution on weekdays and weekends

Insights:

  • Developers are most active on weekdays, with 77.73% of events occurring on weekdays.

The distribution of specific events

developer-behavior-distribution-from-monday-to-sunday
Developer behavior distribution from Monday to Sunday

Insights:

  • Pull Request Event, Pull Request Review Event, and Issues Event all have the highest percentage on Tuesdays, while the lowest percentage is on the weekends.
  • The amount of Push Event, Watch Event, and Fork Event activities are similar on weekdays and weekends, while the Pull Request Review Event is the most different. Watch Event and Fork Event are more personal behaviors, Pull Request Review Events are more work behaviors, and Push Events are used more in personal projects.

Each year, technology introduces new buzz words. Can we gain insight into technical trends through the open source repositories behind the hot words? We investigated five technical areas: Low Code, Web3, GitHub Actions, Database, and AI.

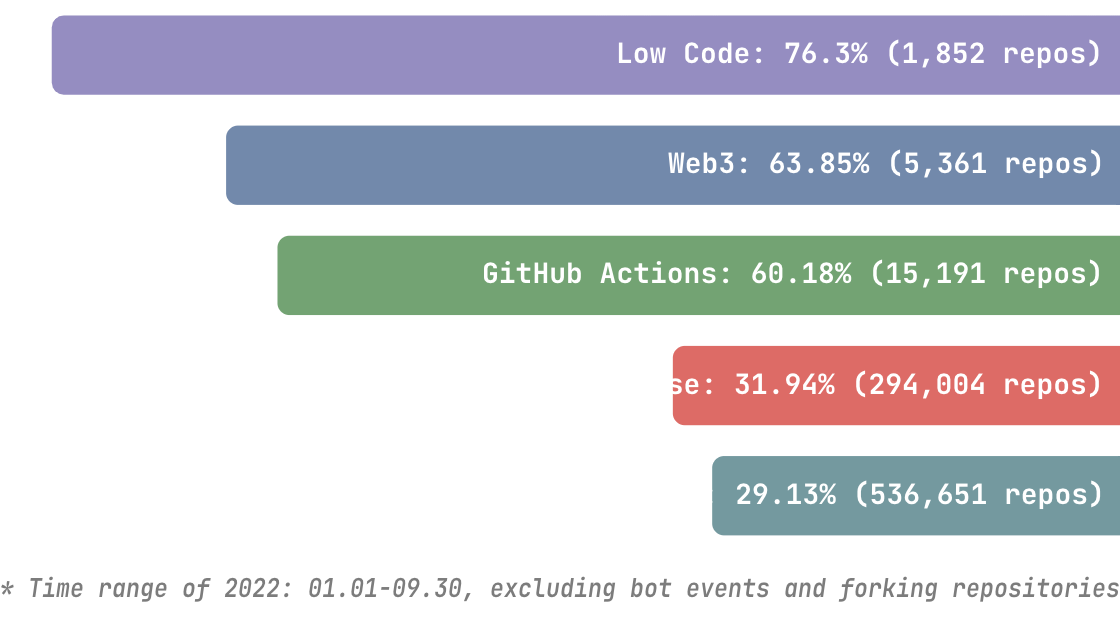
We queried the number of open source repositories associated with each technical area, as well as the percentage of active repositories in 2022.


activity-levels-of-popular-topics
Activity levels of popular topics

This figure shows that open source repositories in the Low Code topic are the most active, with 76.3% being active in 2022, followed by Web3 with 63.85%.

We queried the following items for each technical area from 2015 to 2022:

  • The annual increment of repositories
  • The annual increment of collaborative events
  • The number of developers participating in collaborative events
  • The annual increment of stars

Then, we calculated the growth rate for each year which can reflect new entrants, developer engagement in this technical field, and the industry's interest in this area. For 2022, we compare its first nine months with the first nine months of 2021.


low-code-repositories
Low code repositories

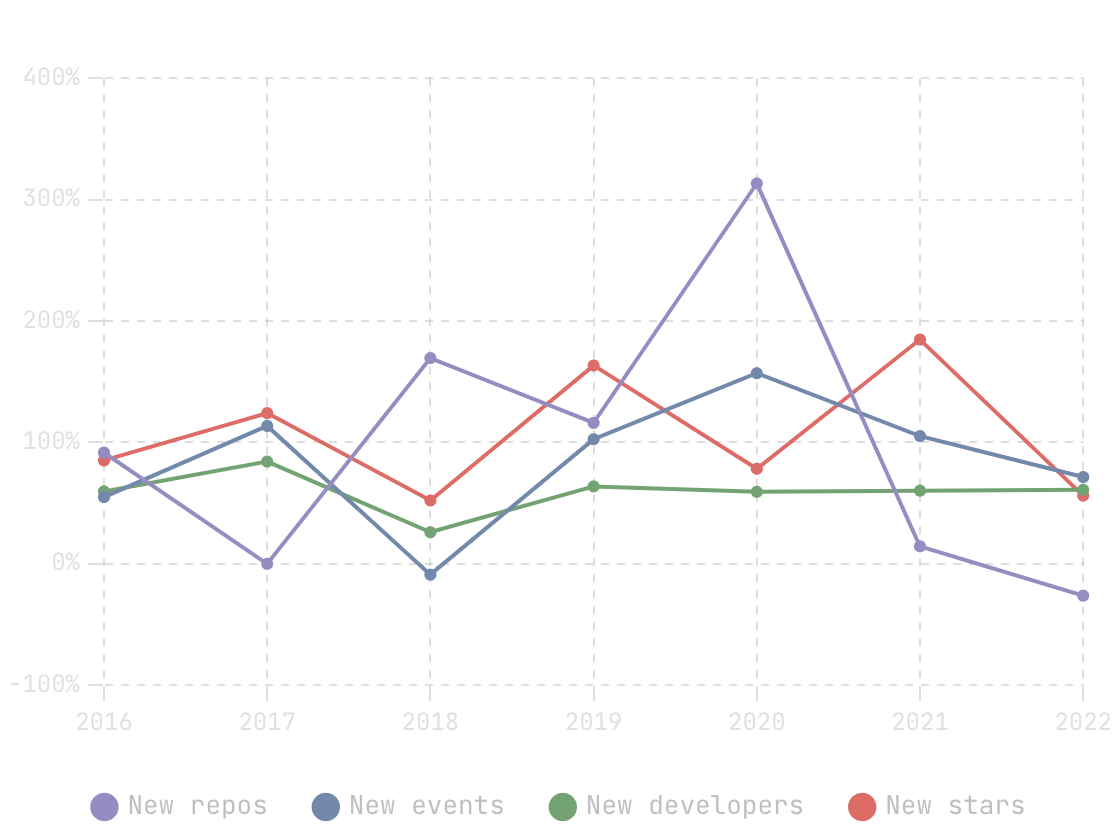
We can see that 2020 is the peak period of project development, with a 313.43% increase in new repositories and a 157.06% increase in developer collaborative events. The industry's interest increased most significantly in 2021, reaching 184.82%. In 2022, the year-on-year growth data shows that the number of new repositories decreased (-26.21%), but developer engagement and industry interest are still rising.

* Time range of 2022: 01.01-09.30, excluding bot events and forking repositories


web3-repositories
Web3 repositories

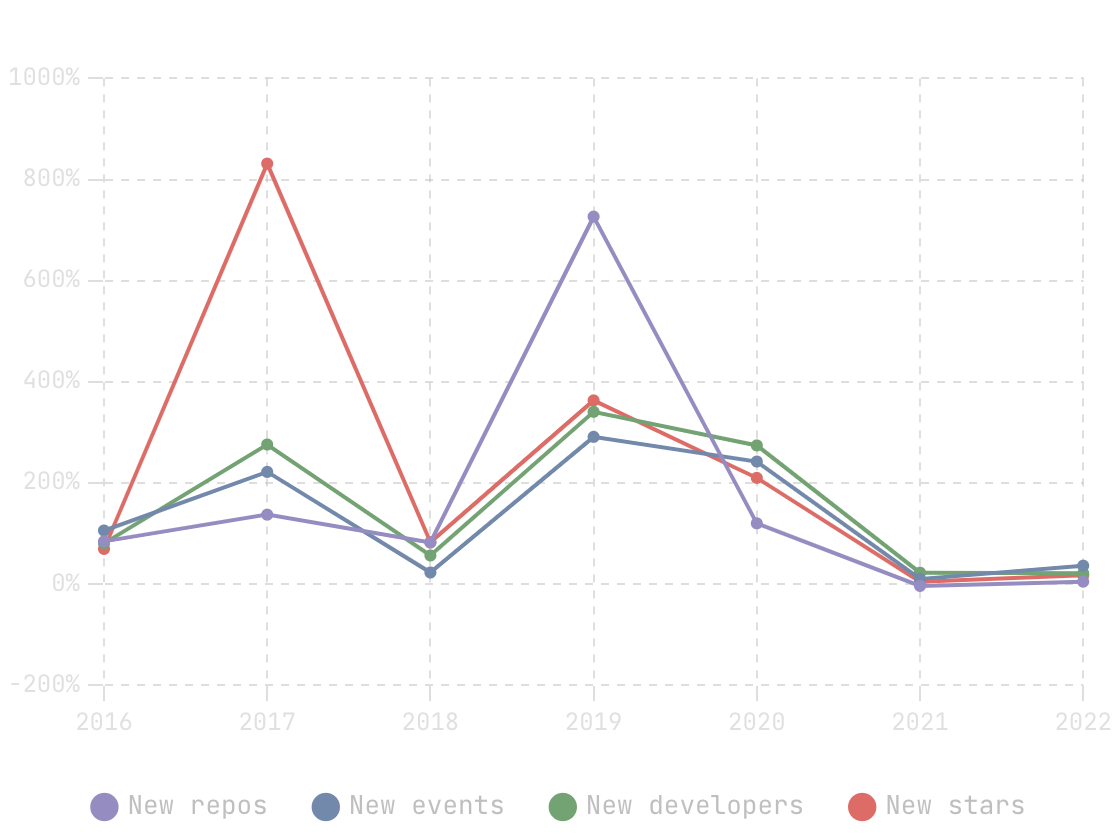
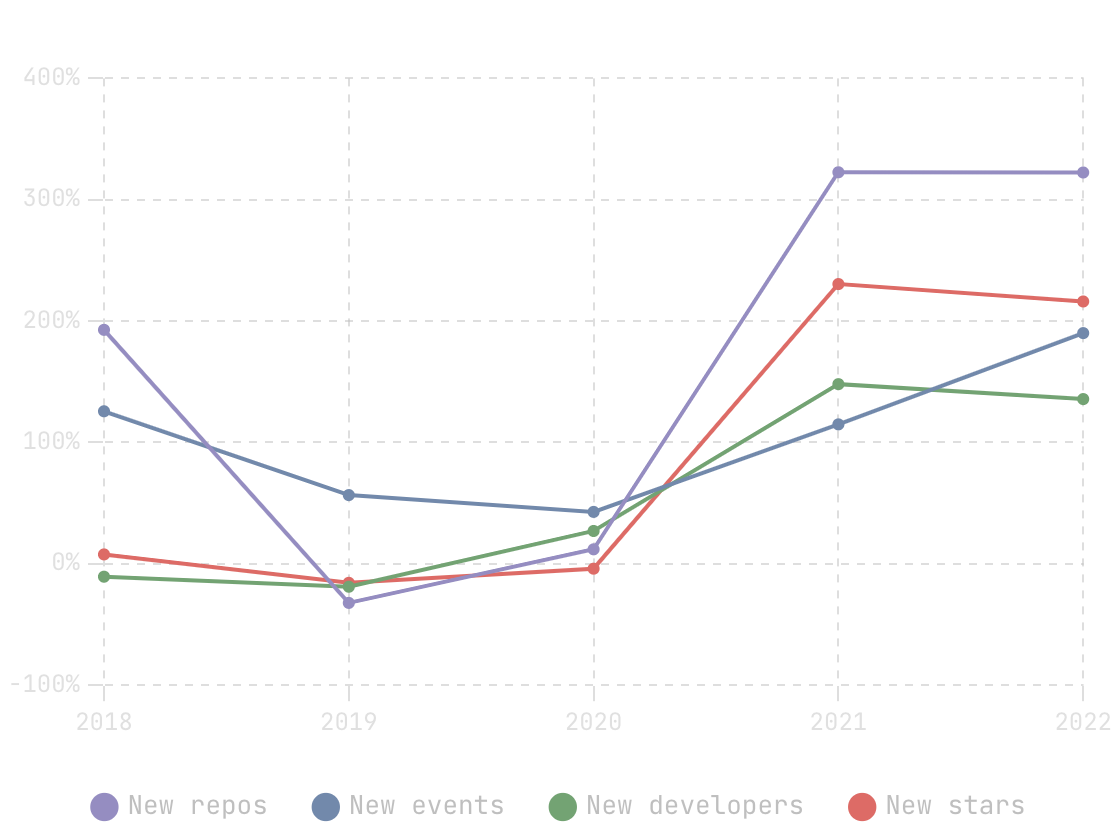
Whether it is the creation of new repositories, developers, or the interest of the industry, the Web3 ecosystem has grown rapidly in recent years, and the growth rate of new repositories peaked at 322.65% in 2021.

* Time range of 2022: 01.01-09.30, excluding bot events and forking repositories


github-actions-repositories
GitHub Actions repositories

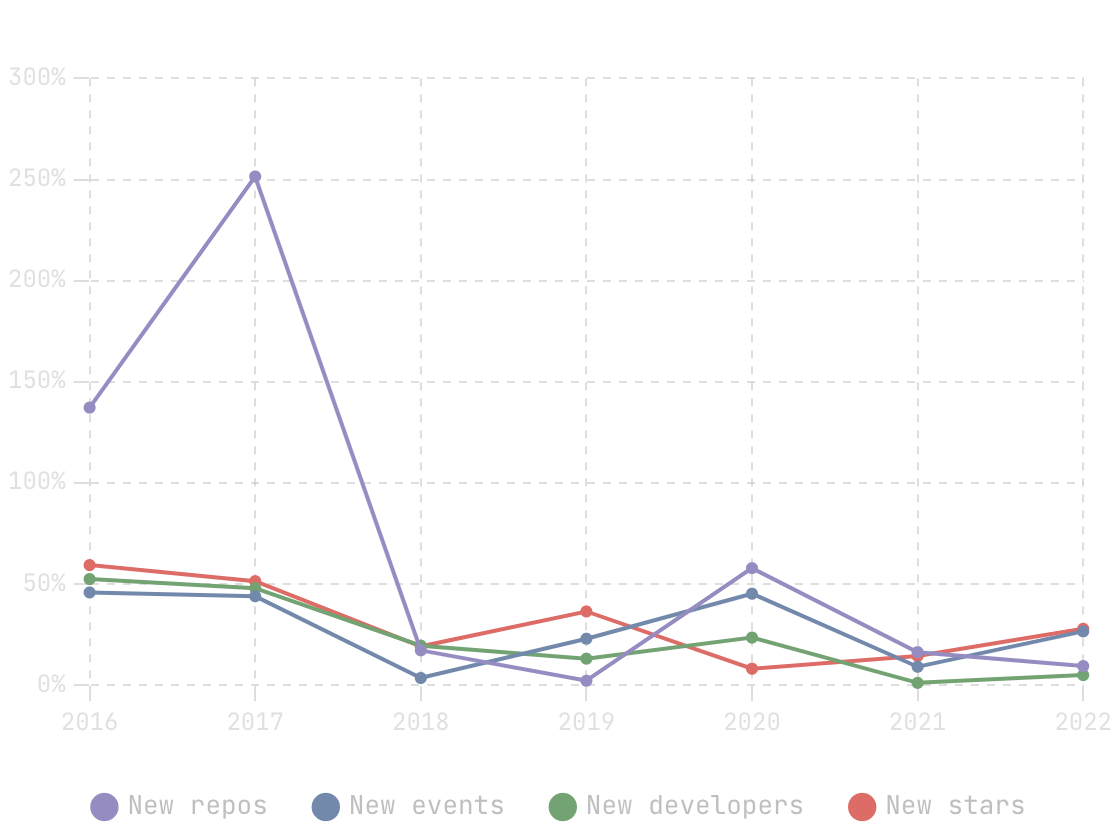
The annual increase of GitHub Actions repositories has been declining, but developer engagement and the industry's interest are still increasing slightly.

* Time range of 2022: 01.01-09.30, excluding bot events and forking repositories


database-repositories
Database repositories

As an infrastructure project, the Database project's threshold is high. Compared with projects in other fields, a database project has a stable growth rate.

* Time range of 2022: 01.01-09.30, excluding bot events and forking repositories


ai-repositories
AI repositories

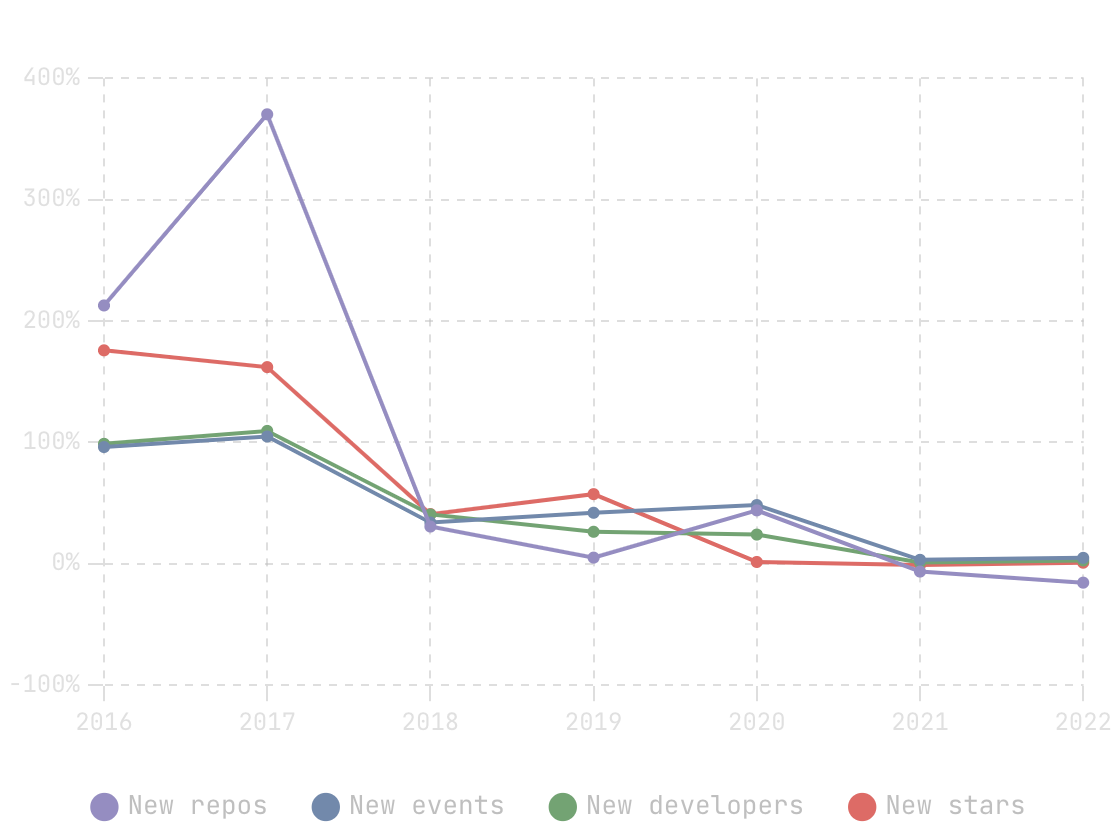
After two years of high growth in 2016 and 2017, open source projects in AI have been growing gradually slowly.

* Time range of 2022: 01.01-09.30, excluding bot events and forking repositories

The number of stars is the most visible indication of the popularity of open source projects. We looked at the 50 projects that received the most stars from January 1 to September 30, 2022. We found that:


most-popular-repositories-2022
The most popular repositories in 2022

* Time range: 2022.01.01-2022.09.30, excluding bot events

The most active repositories over the past four years

Here we looked up the top 20 active repositories per year from 2019 to 2022 and counted the total number of listings per repository. The activity of the repository is ranked according to the number of developers participating in collaborative events.

Repository NameCount
microsoft/vscode4
flutter/flutter4
MicrosoftDocs/azure-docs4
firstcontributions/first-contributions4
Facebook/react-native4
pytorch/pytorch4
microsoft/TypeScript4
tensorflow/tensorflow3
kubernetes/kubernetes3
DefinitelyTyped/DefinitelyTyped3
golang/go3
google/it-cert-automation-practice3
home-assistant/core3
microsoft/PowerToys3
microsoft/WSL3

Insights:

  • Microsoft has the most repositories on the list, with five.

  • tensorflow/tensorflow and kubernetes/kubernetes both dropped out of the top 20 after three consecutive years on the list (2019 to 2021).

  • New to the 2022 list are archway-network/testnets, element-fi/elf-council-frontend, solana-labs/token-list, education/GitHubGraduation-2022, taozhiyu/TyProAction, NixOS/nixpkgs, rust-lang/rust.

  • Time range: 2022.01.01-2022.09.30, excluding bot events

Who gave the most stars in 2022

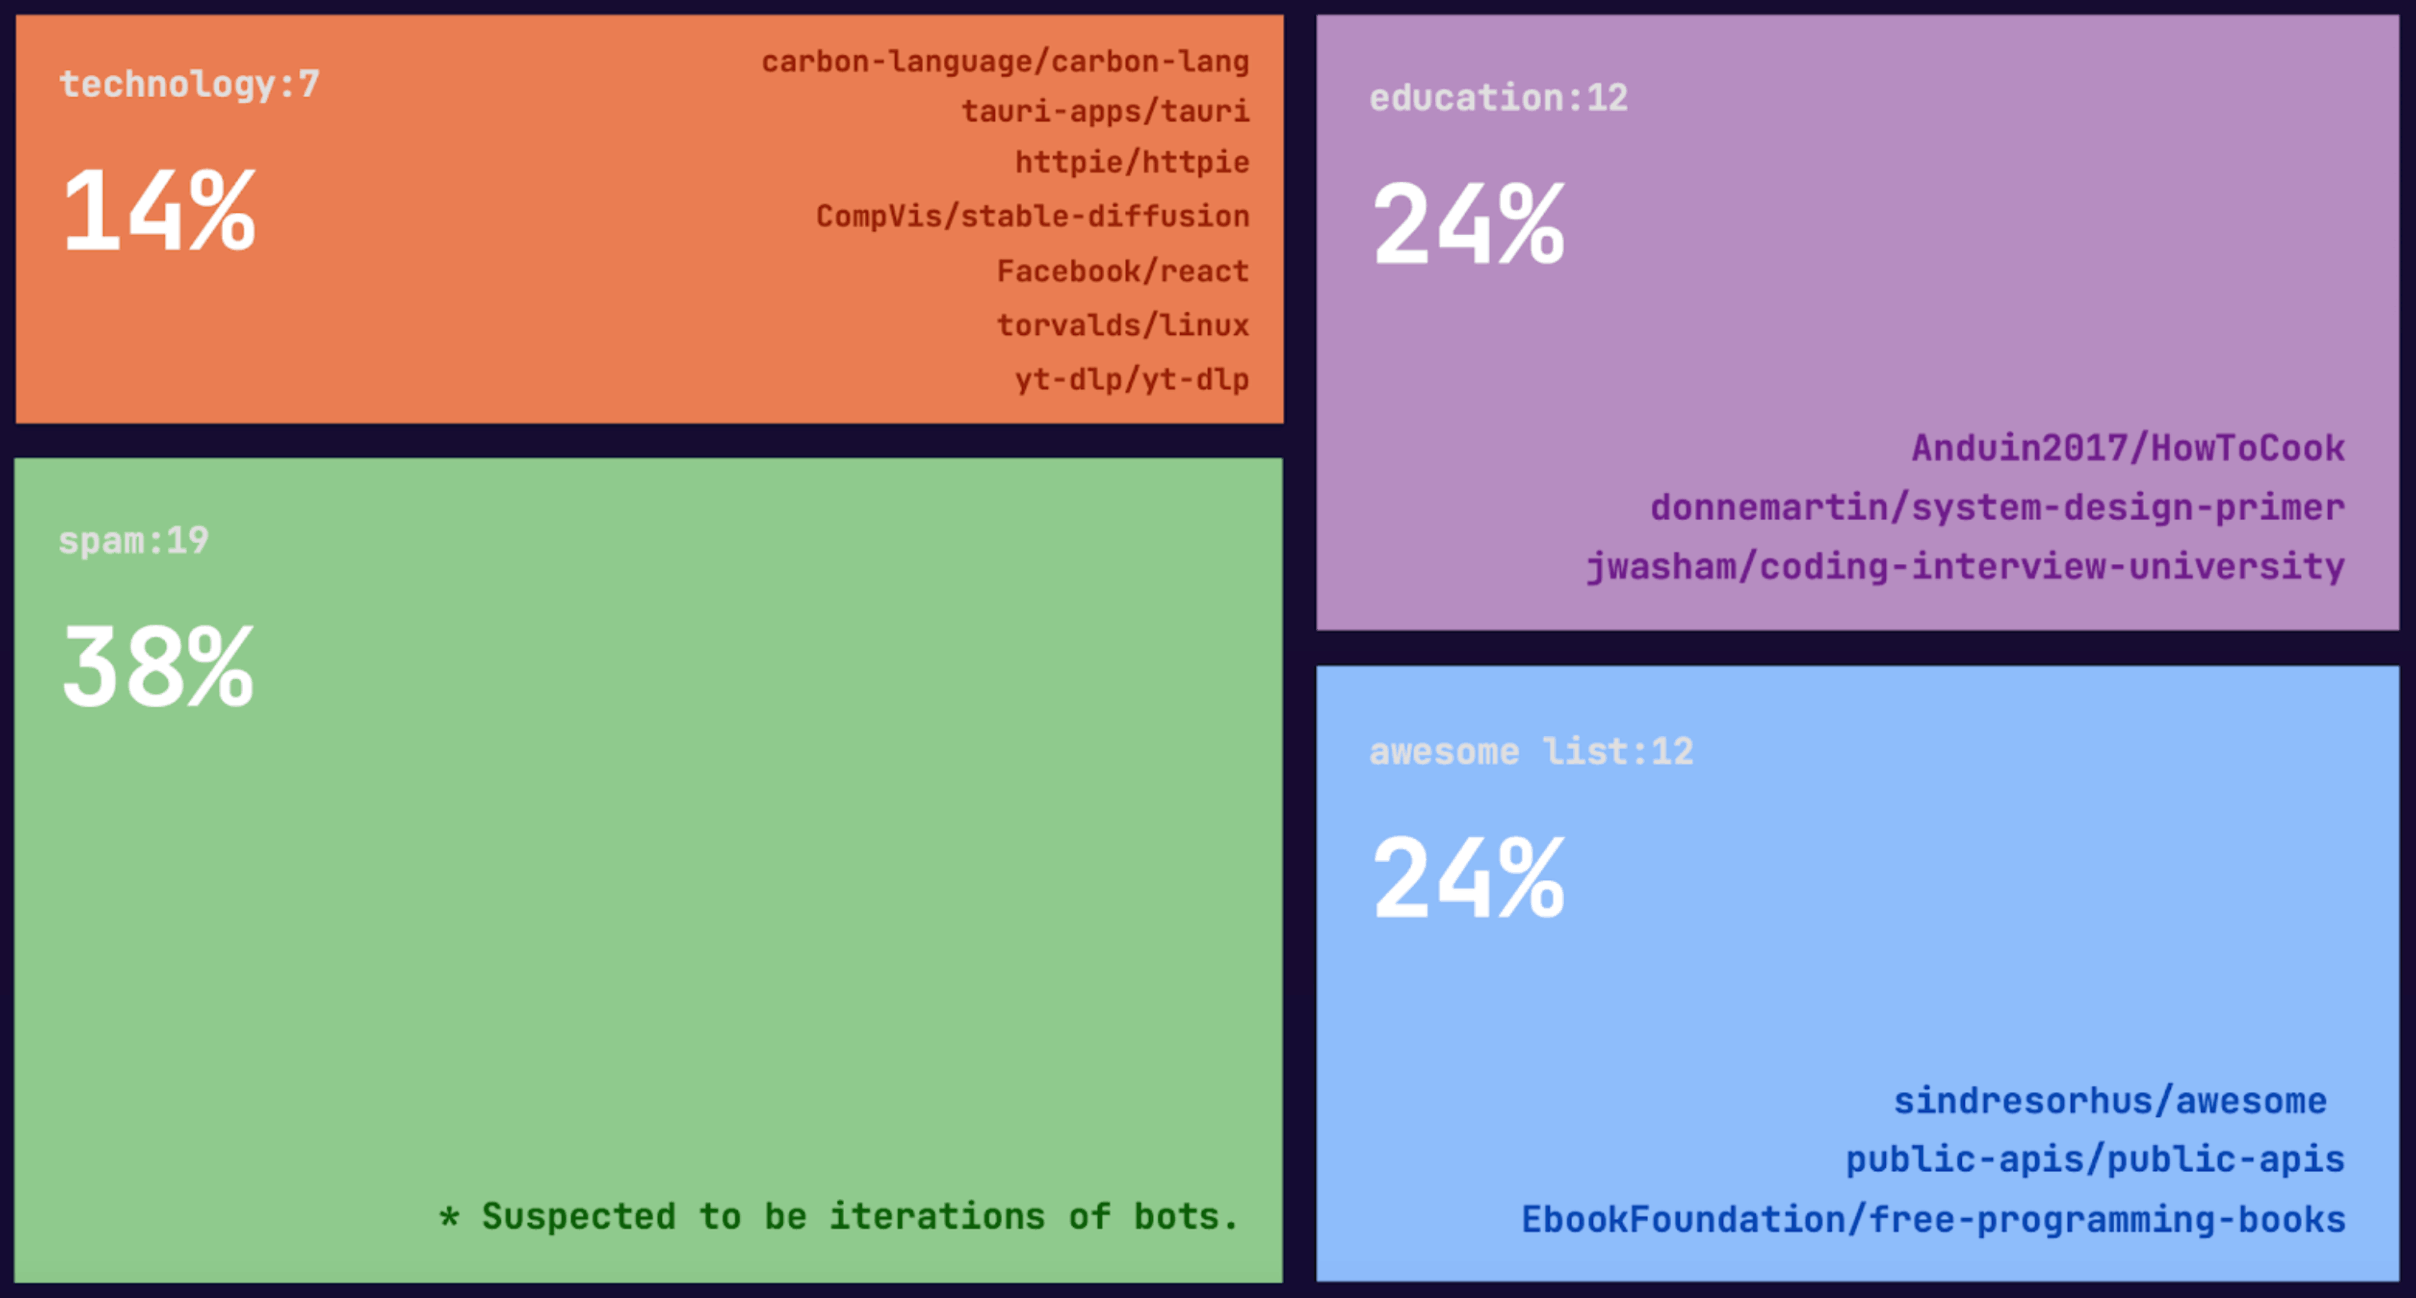
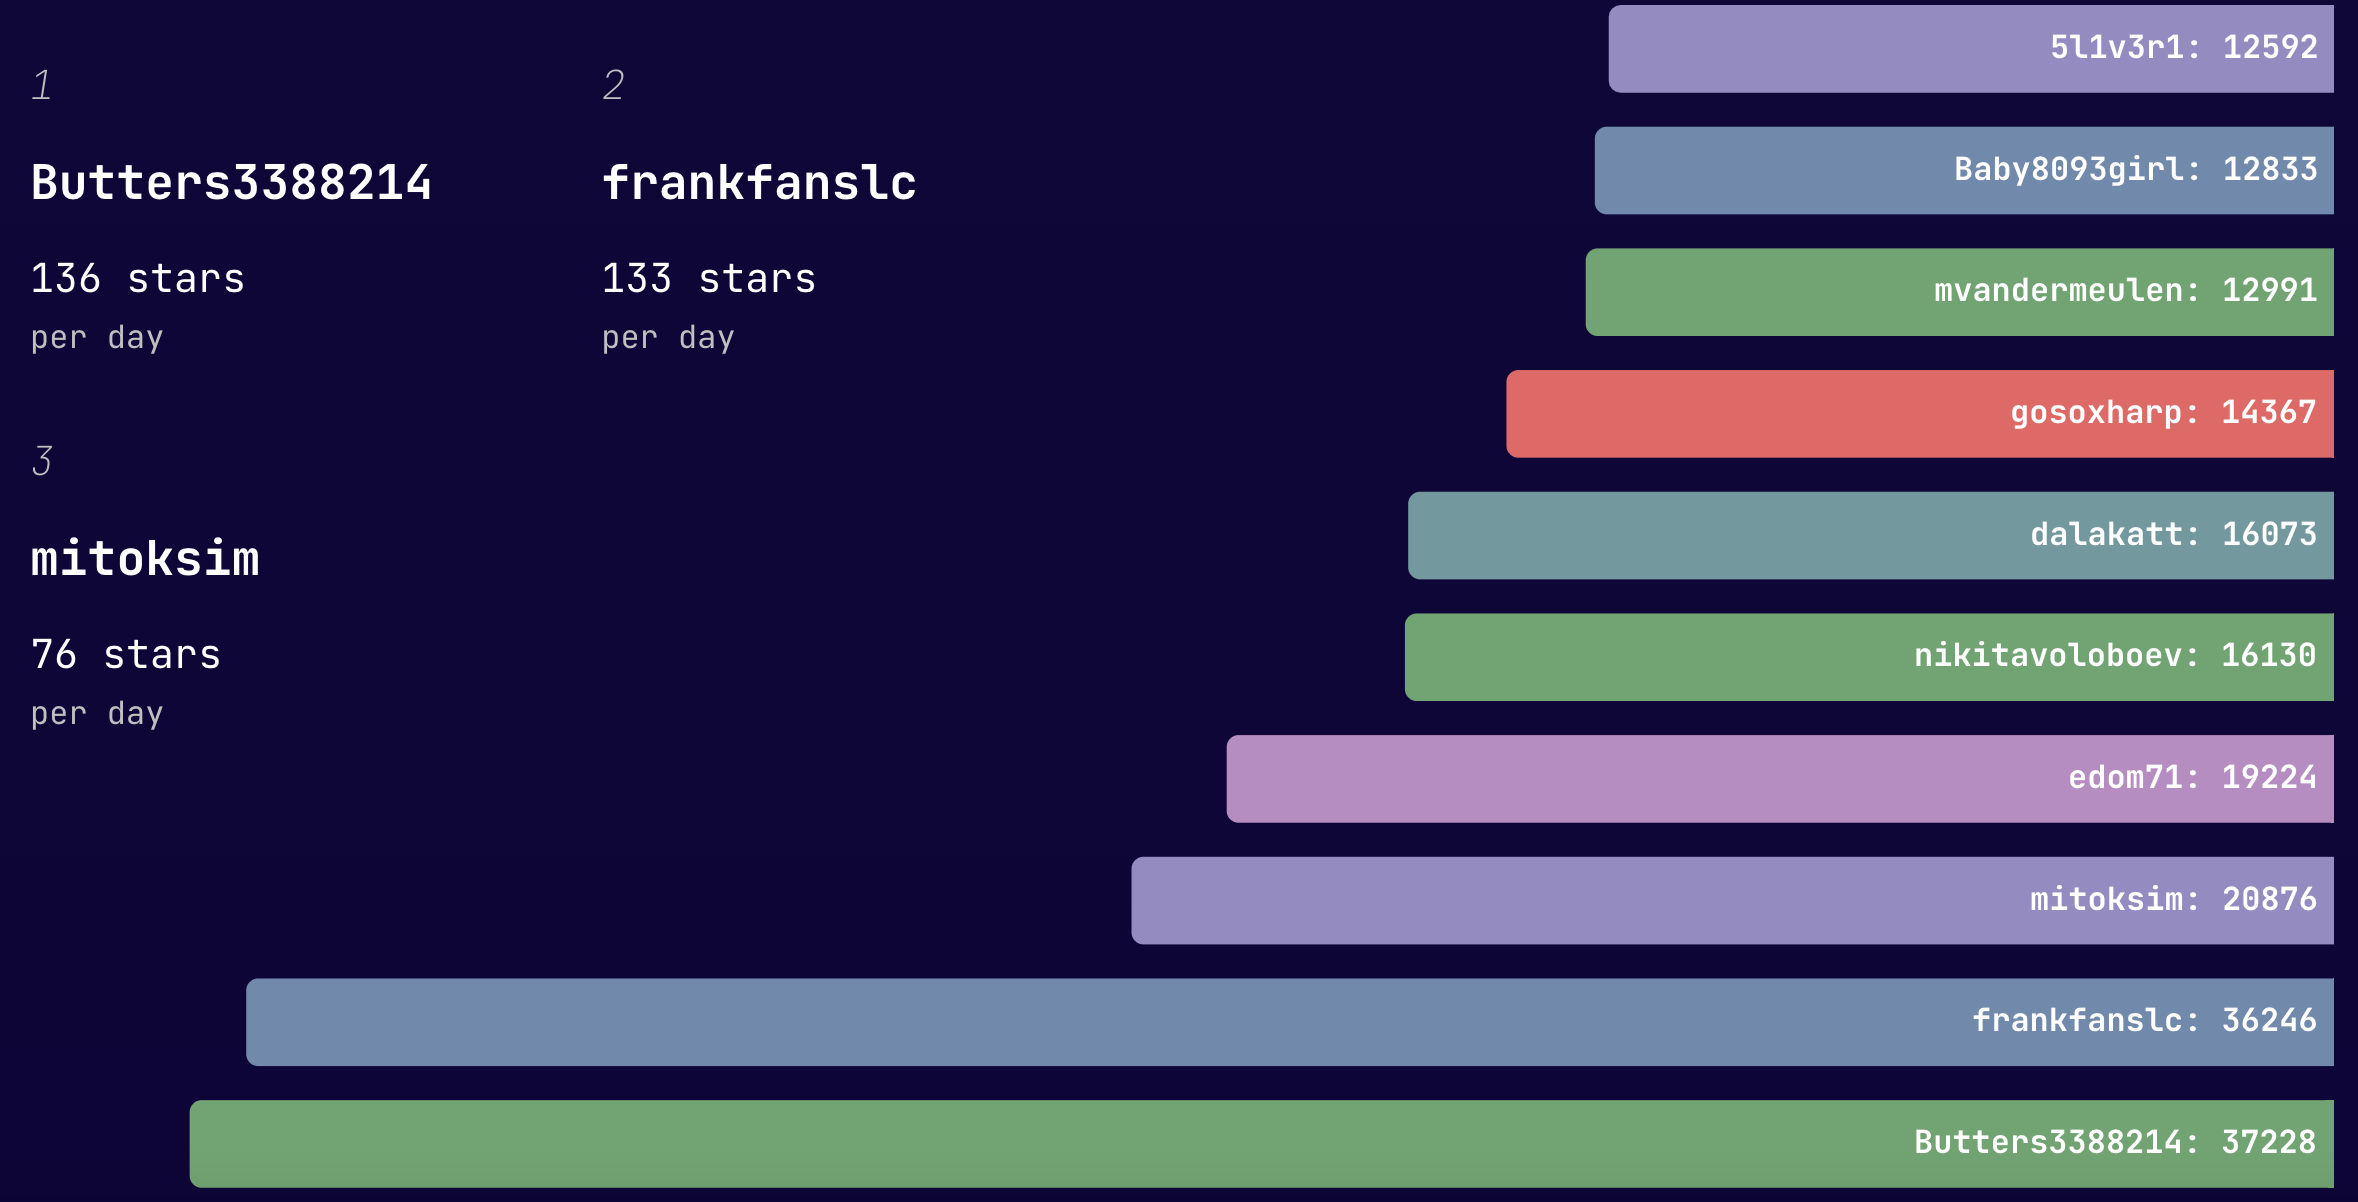
We queried the developers who gave the most stars in 2022, took the top 20, and filtered out accounts of suspected bots. If a developer's number of star events divided by the number of starred repositories is equal to or greater than 2, we suspect this user to be a bot.


developers-most-stars
Developers who gave the most stars

We found that until September 30, 2022, the developer who starred the most repositories had starred a total of 37,228 repositories, an average of 136 repositories per day.

* Time range: 2022.01.01-2022.09.30, excluding bot events

The most active developers since 2011

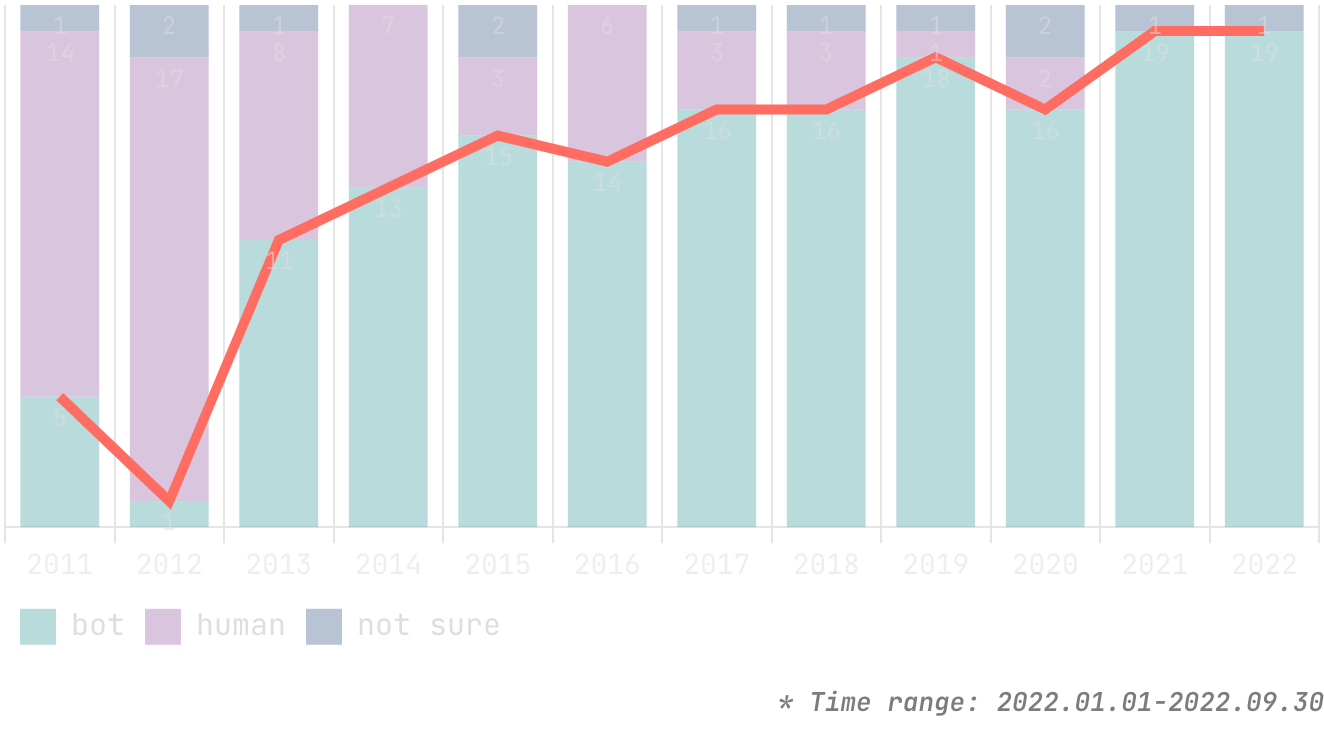
We queried the top 20 most active developers per year since 2011. This time we didn't filter out bot events.


most-active-developers
The most active developers

We found that the percentage of bots is becoming larger and larger. Bots started to overtake humans in 2013 and have reached over 95% in 2022.

Appendix

Term description

  • GitHub events: GitHub events are triggered by user actions, like starring a repository or pushing code.
  • Time range: In this report, the data collection range of 2022 is from January 1, 2022 to September 30, 2022. When comparing data of 2022 with another year, we use year-on-year analysis.
  • Bot events: Bot-triggered events account for a growing percentage of GitHub events. However, these events are not the focus of this report. We filtered out most of the bot-initiated events by matching regular expressions.

How we classify technical fields by topics

We do exact matching and fuzzy matching based on the repository topic. Exact matching means that the repository topics have a topic that exactly matches the word, and fuzzy matching means that the repository topics have a topic that contains the word.

TopicExact matchingFuzzy matching
GitHub Actionsactionsgithub-action, gh-action
Low Codelow-code, lowcode, nocode, no-code
Web3web3
Databasedbdatabase, databases
nosql, newsql, sql
mongodb,neo4j
AIai, aiops, aiotartificial-intelligence, machine-intelligence
computer-vision, image-processing, opencv, computervision, imageprocessing
voice-recognition, speech-recognition, voicerecognition, speechrecognition, speech-processing
machinelearning, machine-learning
deeplearning, deep-learning
transferlearning, transfer-learning
mlops
text-to-speech, tts, speech-synthesis, voice-synthesis
robot, robotics
sentiment-analysis
natural-language-processing, nlp
language-model, text-classification, question-answering, knowledge-graph, knowledge-base
gan, gans, generative-adversarial-network, generative-adversarial-networks
neural-network, neuralnetwork, neuralnetworks, neural-network, dnn
tensorflow
PyTorch
huggingface
transformers
seq2seq, sequence-to-sequence
data-analysis, data-science
object-detection, objectdetection
data-augmentation
classification
action-recognition

· 5 min read
Mia Zhou
Wink Yao
Caitin Chen

The OSS Insight website displays the data changes of GitHub events in real time. GitHub events are activities triggered by user actions on GitHub, for example, commenting and forking a repository. In nearly seven weeks, GitHub events increased by about 150 million, from 4.7 billion to 4.85 billion. GitHub events are booming!

This post dives deeply into GitHub event trending, why GitHub events are surging, and whether GitHub's architecture can handle the increasing load.

Historical data analysis

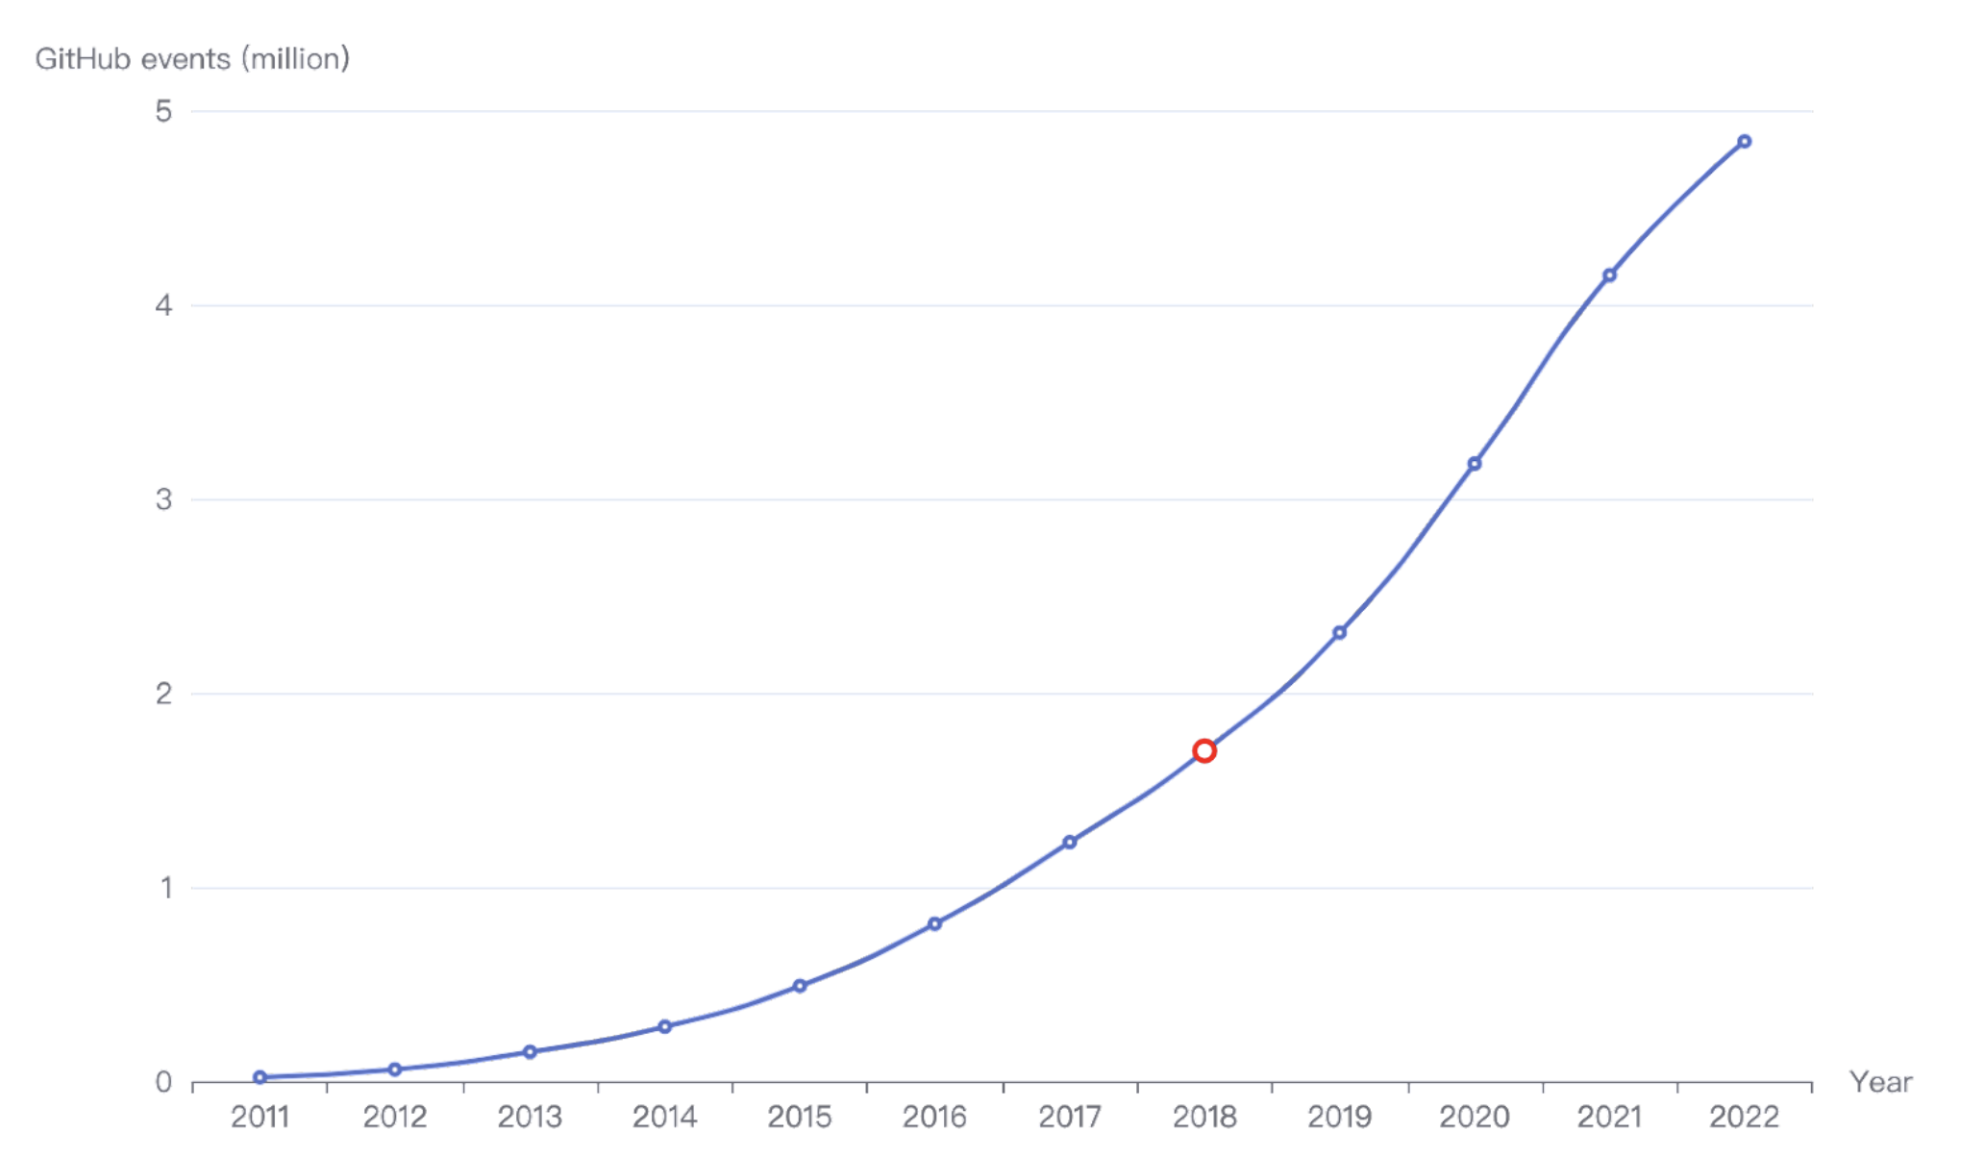
The OSS Insight database includes all the GitHub events since 2011. When we plot the number of events by year, we can see that since 2018 they have been increasing rapidly.


GitHub event trending

GitHub event trending

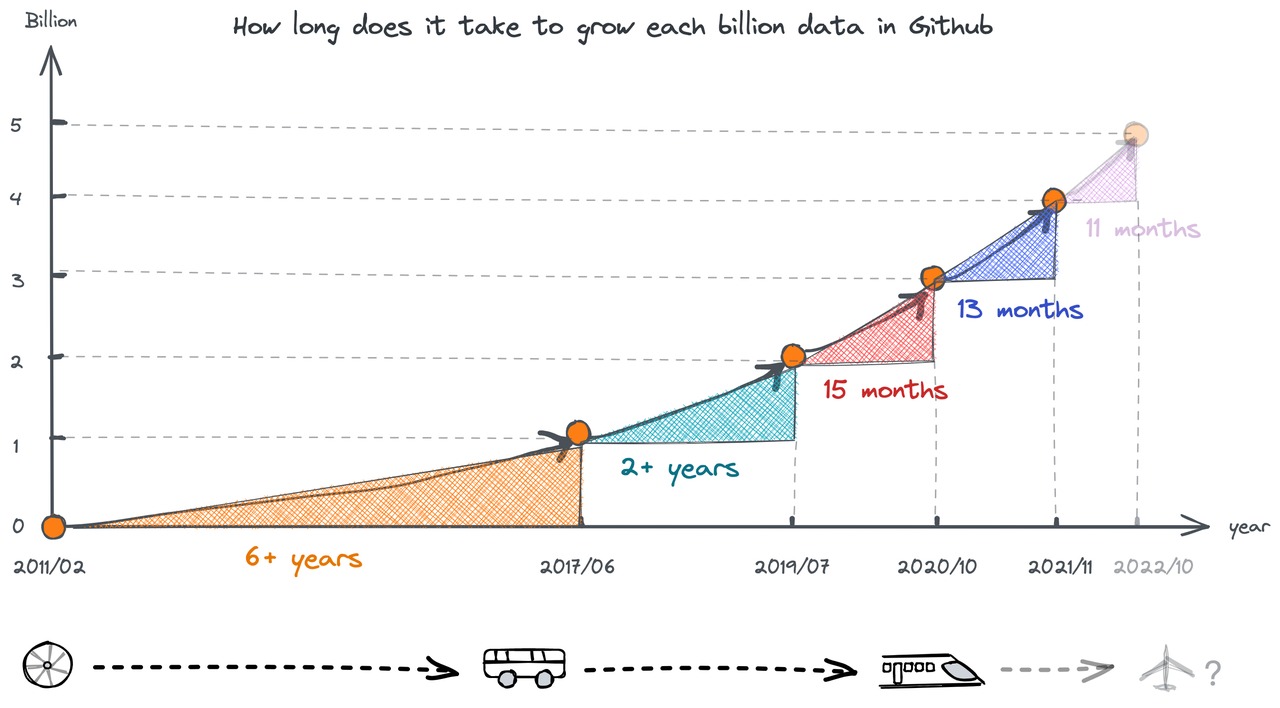
The figure below shows how long it takes to grow each billion events in GitHub.


The time to reach a billion GitHub events

The time to reach a billion GitHub events

It's taking less and less for GitHub to generate 1 billion events. It took more than 6 years for the first billion events and only 13 months for the last billion!

The secret behind the exponential growth of GitHub events

GitHub Actions was released in October 2018. Since August 2019, it has supported continuous integration and continuous delivery (CI/CD), and it has been free for open source projects. Therefore, projects hosted on GitHub can automate their own development workflows, and a large number of automation-related bot applications have appeared on GitHub Marketplace. Could GitHub events' data growth be related to these?

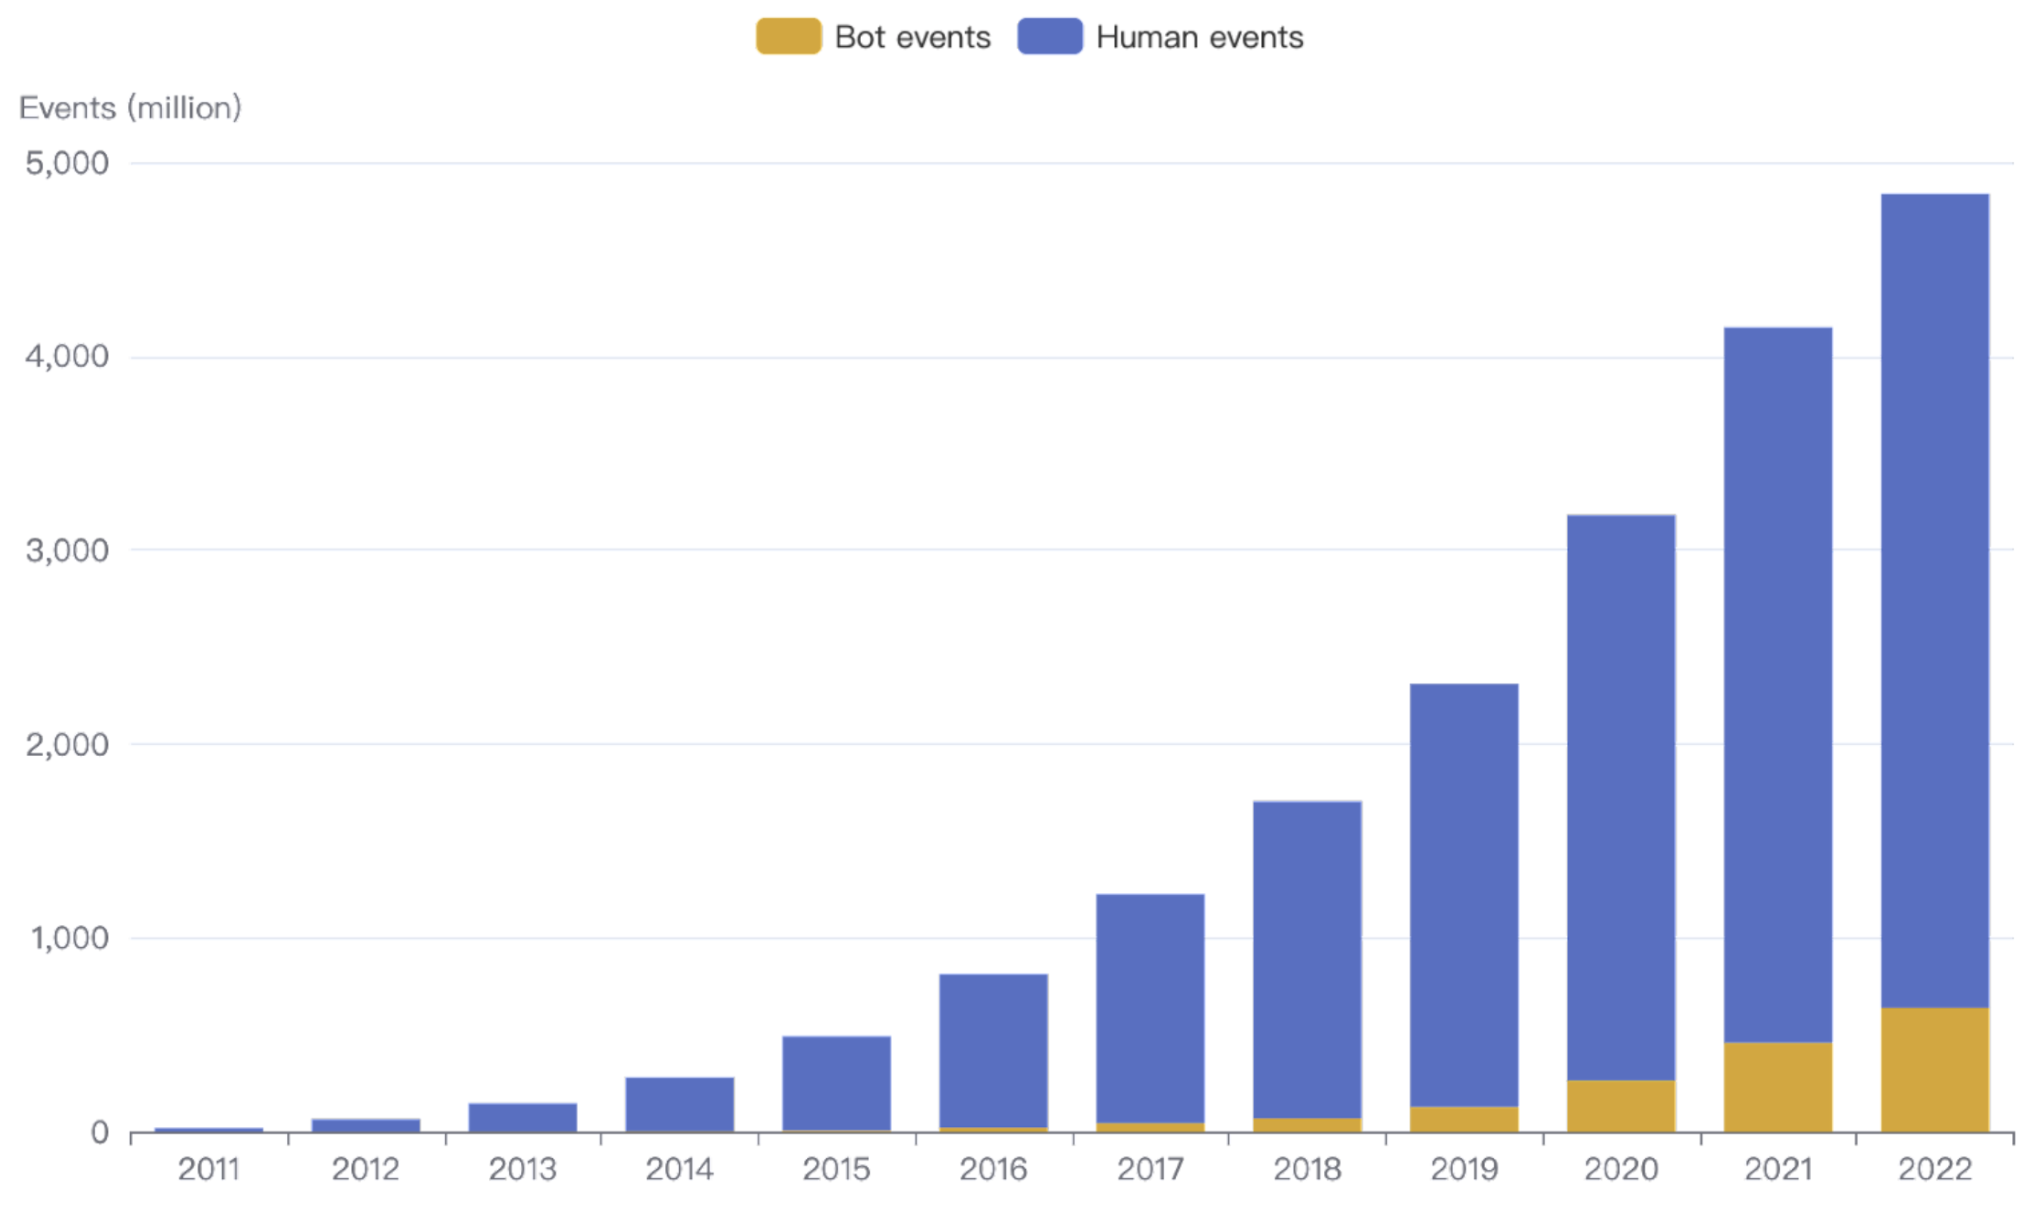
To find the answer, we divided the events into data from humans and data from bots and plotted them with the following histogram. The blue columns represent the human data, and the yellow columns represent the bot data.


Bot events vs. human events

Bot events vs. human events

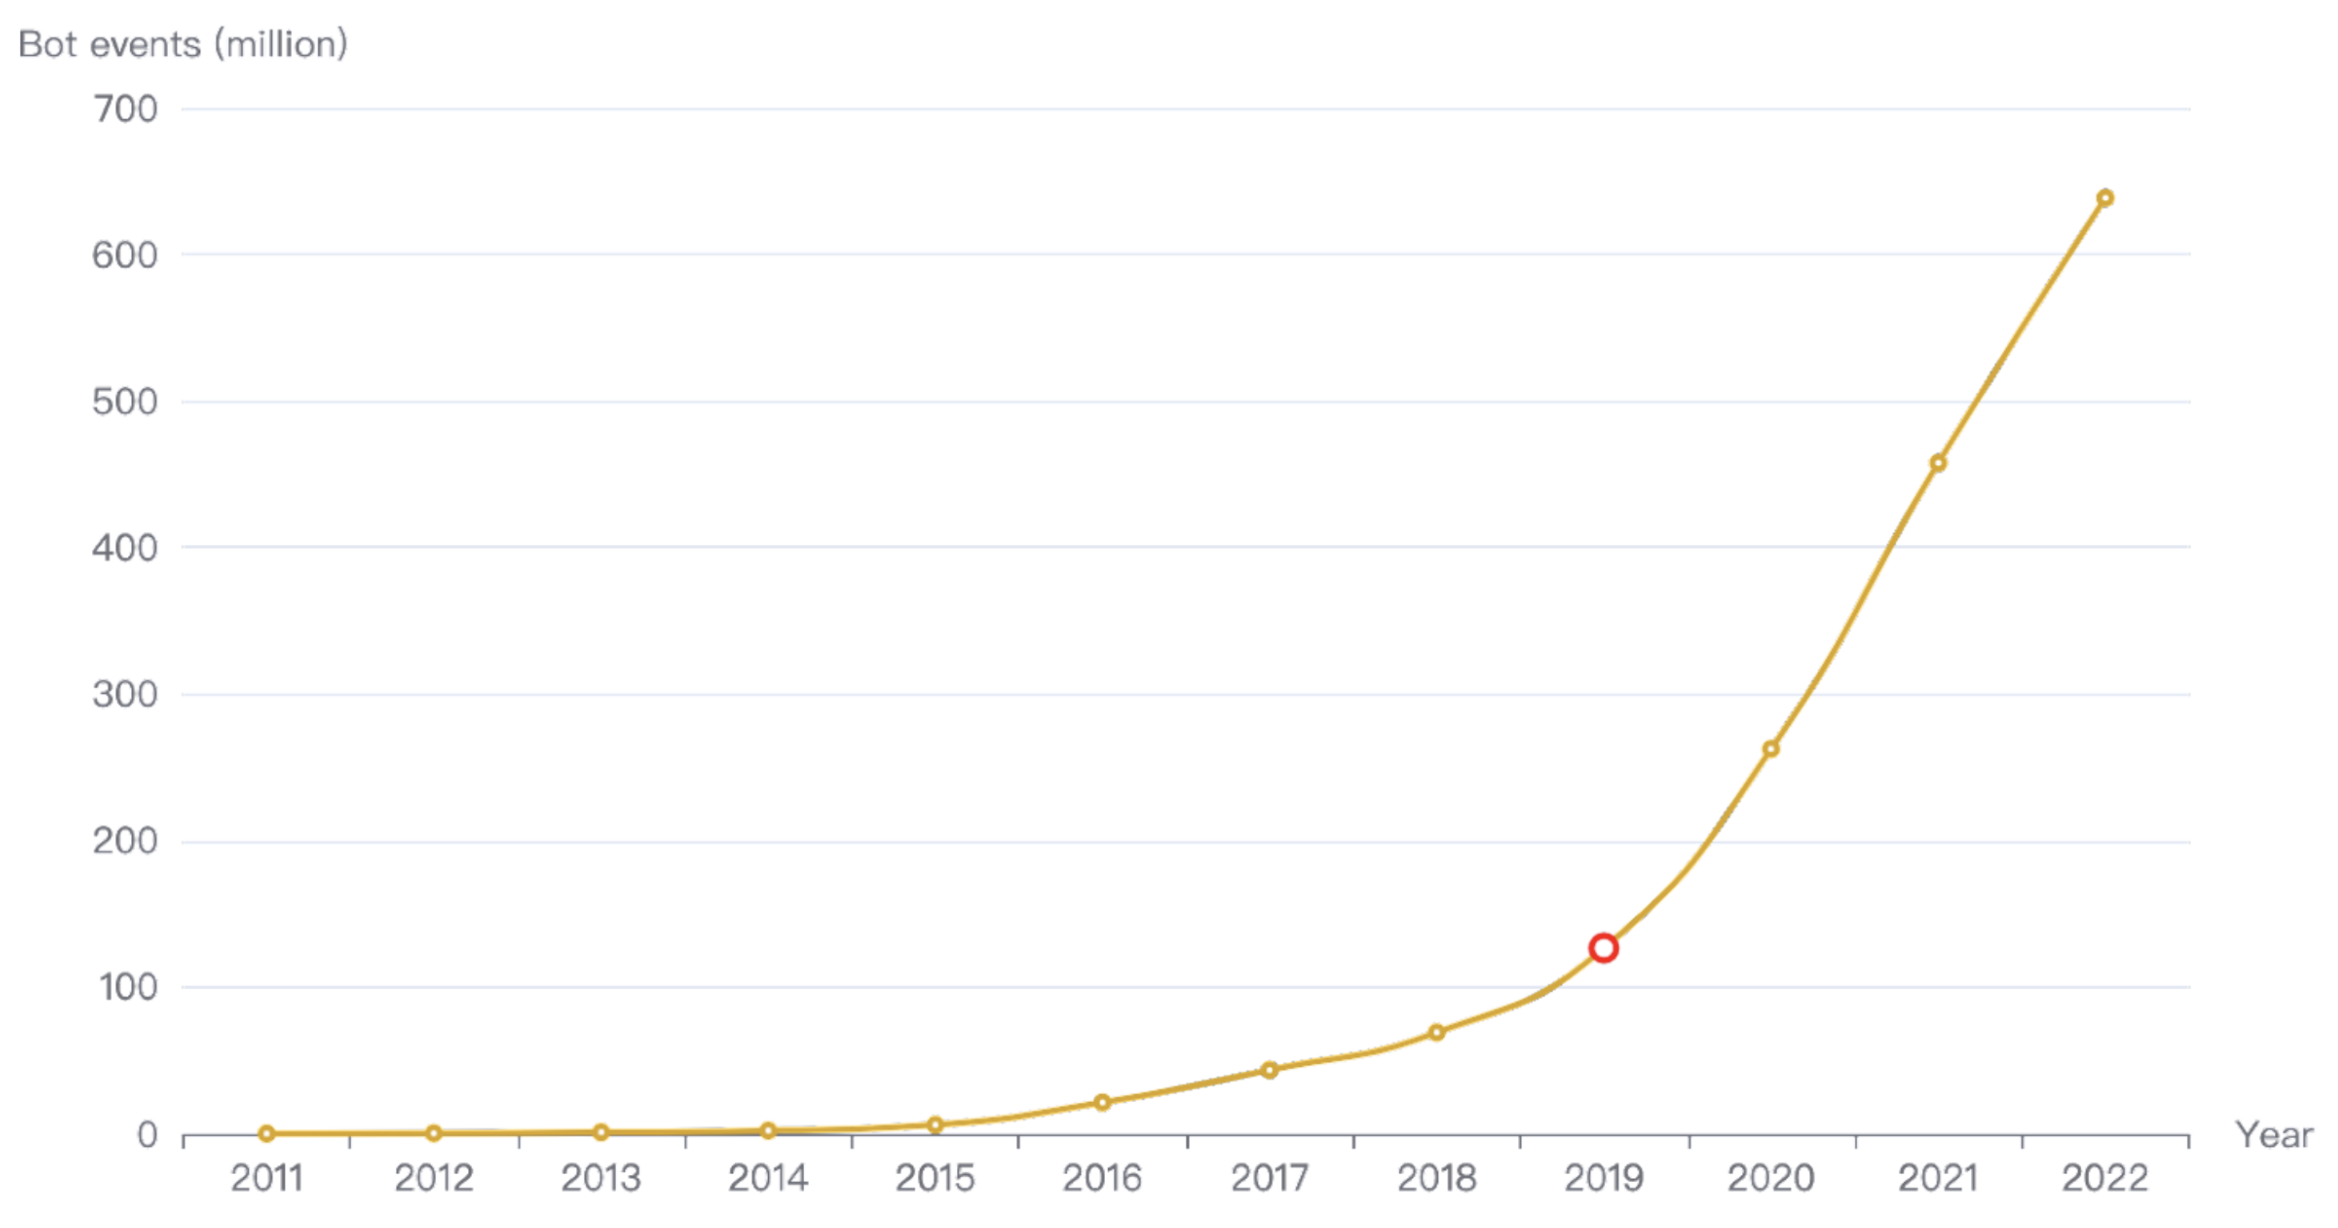
As you can see, the proportion of GitHub bot events has increased each year. In 2015, they were only 1.23% of all events. In early July of this year, they reached 13.2%. To show the data changes of bot events more clearly, we made the following line chart.


Bot event trending

Bot event trending

This figure shows that since 2019, bot events have been grown faster than before. As Mini256, a TiDB community contributor said in Love, Code, and Robot — Explore robots in the world of code:

For now, rough statistics find that there are more than 95,620 bots on GitHub. The number doesn't seem like so much, but wait...

These 95 thousand bot accounts generated 603 million events. These events account for 12.82% of all public events on GitHub, and these GitHub robots have served over 18 million open source repositories.

Bots are playing an increasingly important role on GitHub. Many projects are handing over automated work to bots. We expect that GitHub events will grow faster in the future.

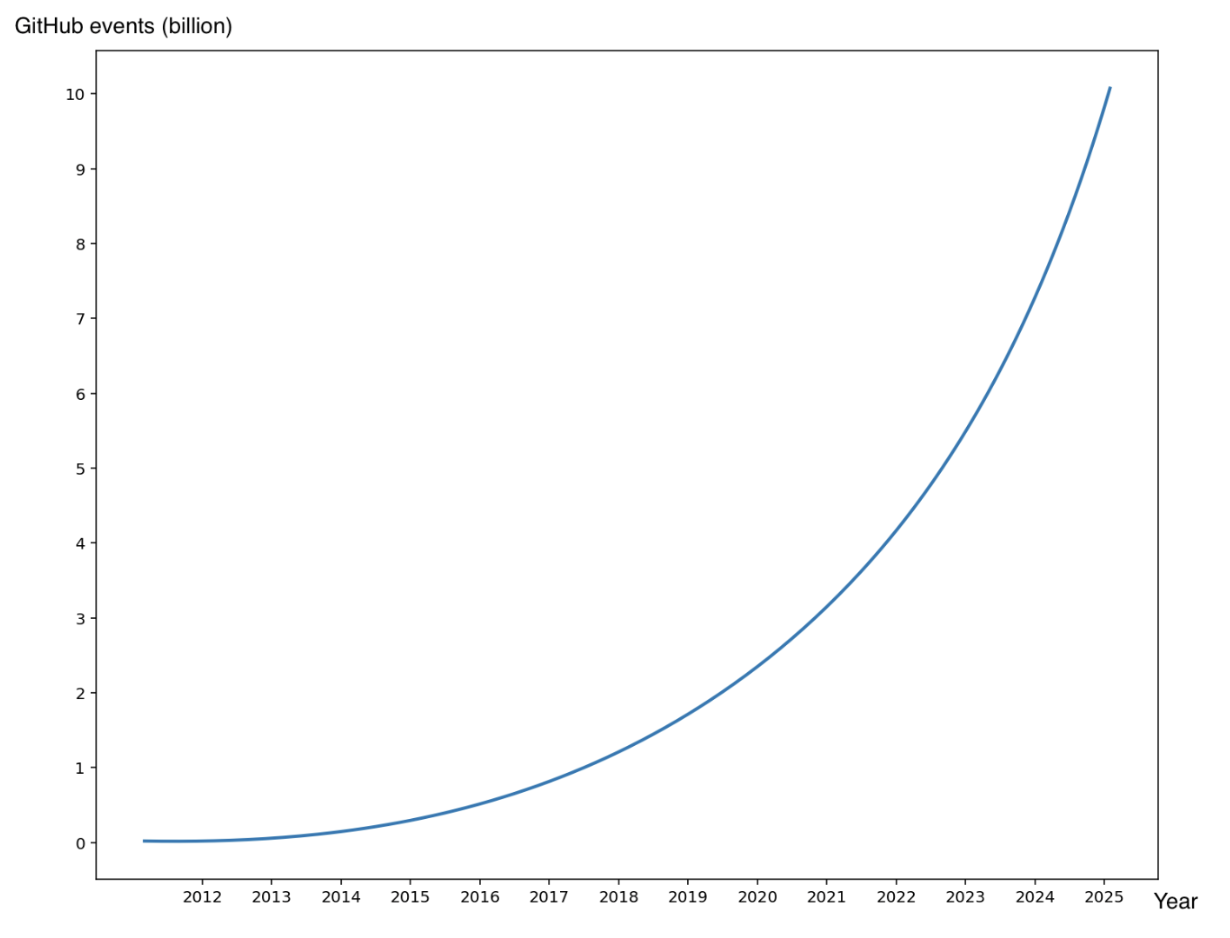
When will GitHub reach 10 billion events?

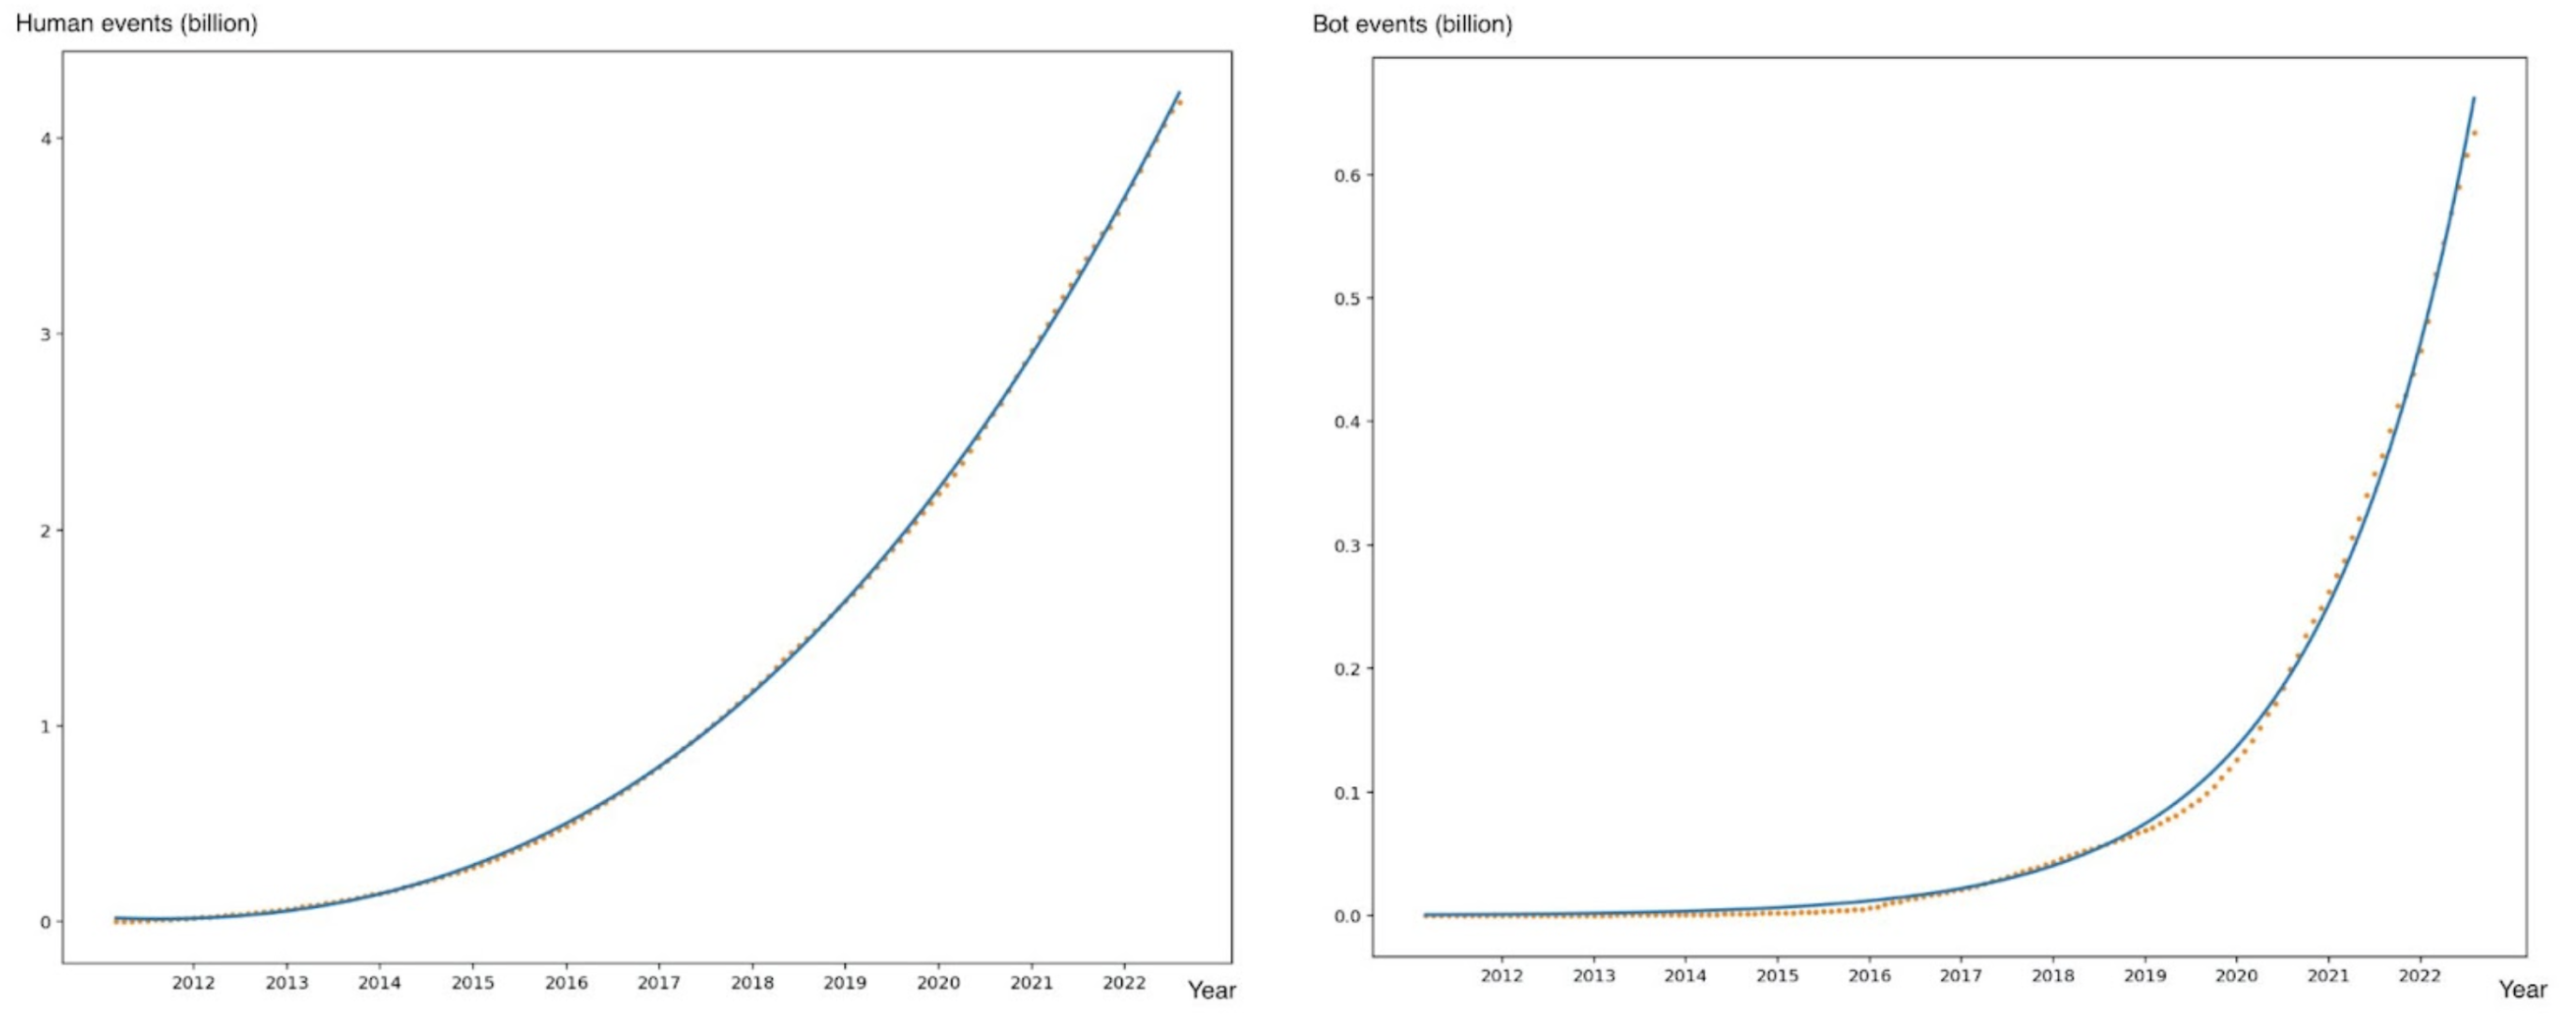
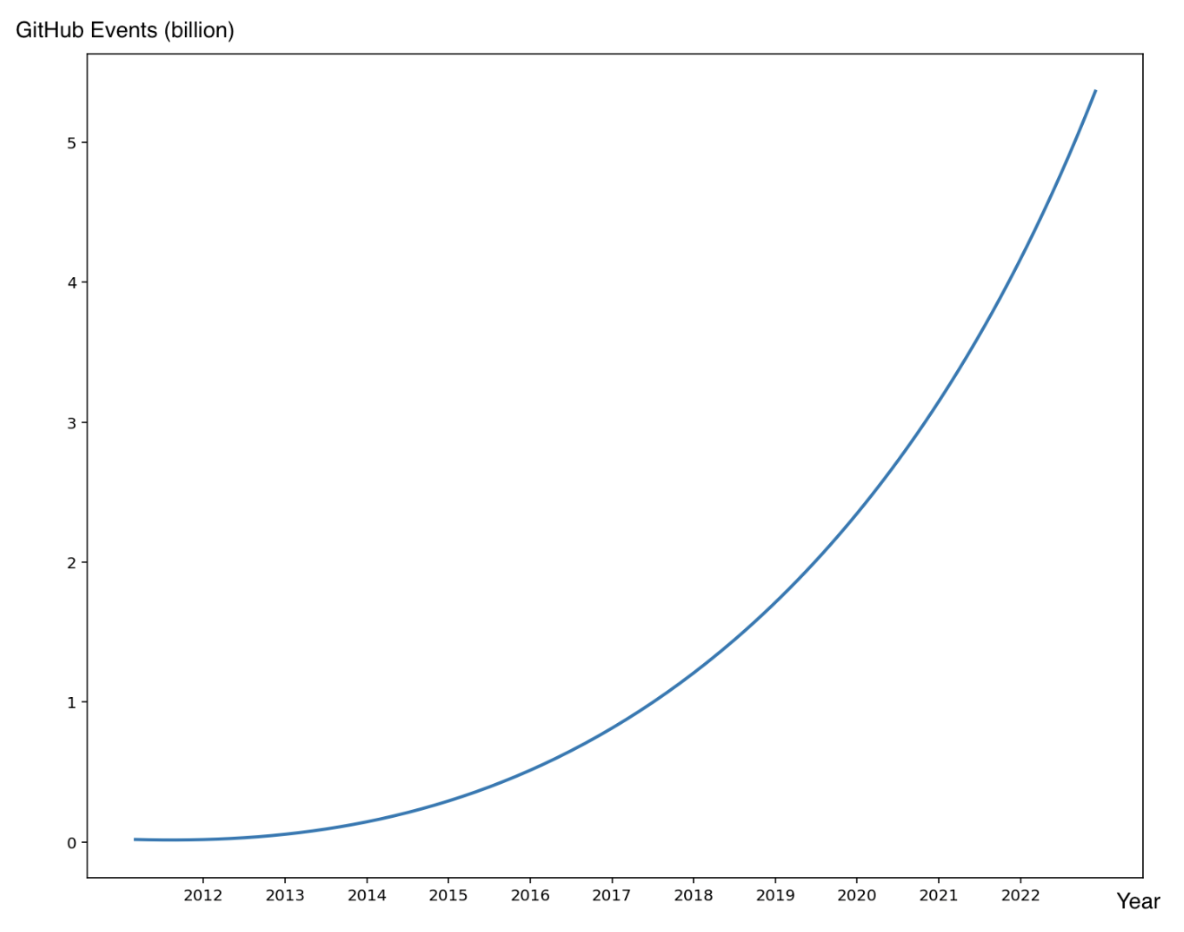
How many GitHub events will there be by the end of 2022? We fit predictions to GitHub historical data.


Human event fit (left) vs. bot event fit (right)

Human event fit (left) vs. bot event fit (right)

It's estimated that by the end of 2022, GitHub events will reach 5.36 billion.


github-event-prediction
GitHub event prediction

According to this prediction, GitHub events will exceed 10 billion in February 2025.


gitub-events-exceed-10-billion
GitHub events will exceed 10 billion in 2025

Can MySQL sharding support such a huge amount of data?

GitHub uses MySQL as the main storage for all non-git warehouse data. The rapid growth of data volume poses a great challenge to GitHub's high availability. In March 2022, GitHub had 3 service disruptions, each lasting 2-5 hours. The official investigation report shows the MySQL database caused the outages. During peak load periods, the GitHub mysql1 database (the main database cluster in GitHub) load increased. Therefore, database access reached the maximum number of connections. This affected the performance of many GitHub services and features.

In fact, over the past few years GitHub has optimized its databases. For example, it added clusters to support platform growth and partitioned the main database. But these improvements did not fundamentally solve the problem. In the near future, GitHub events will exceed 5 billion, or even 10 billion. Can MySQL sharding support such data surge?

Data sources

All the analysis data in this article comes from OSS Insight, a tool based on TiDB to analyze and gain insights into GitHub events data.

You can use it to easily get insights about developers and repositories based on billions of GitHub events. You can also get the latest and historical rankings and trends in technical fields.


The OSS Insight website

The OSS Insight website

· 10 min read
Wink Yao
Fendy Feng

In early January 2022, Max, our CEO, a big fan of open-source, asked if my team could build a small tool to help us understand all the open-source projects on GitHub; and, that if everything worked well, we should open the API to help open source developers to build better insights. In fact, GitHub continuously publishes the public events in its open-source world through the open API. (Thank you and well done! Github). We can certainly learn a lot from the data!

I was excited about this project until Max said: “You’ve only got one week.” Well, the boss is the boss! Although time was tight and we were faced with multiple head-aching problems, I decided to take up this challenge.

Headache 1: we need both historical and real-time data.

After some quick research, we found GHArchive, an open-source project that collects and archives all GitHub data from 2011 and updates it hourly. By the way, a lot of open-source analytical tools such as CNCF's Devstats rely on GH Archive, too.

Thanks to GH Archive, we found the data source.

But there's another problem: hourly data is good, but not good enough. We wanted our data to be updated in real time—or at least near real time. We decided to directly use the GitHub event API, which collects all events that have occurred within the past hour.

By combining the data from the GH Archive and the GitHub event API, we can gain streaming, real-time event updates.


GitHub event updates

GitHub event updates

Headache 2: the data is huge!

After we decompressed all the data from GH Archive, we found there were more than 4.6 billion rows of GitHub events. That’s a lot of data! We also noticed that about 300,000 rows were generated and updated each hour.


The data volume of GitHub events occurred after 2011

The data volume of GitHub events occurred after 2011

The database solution would be tricky here. Our goal is to build an application that provides real-time data insights based on a continuously growing dataset. So, scalability is a must. NoSQL databases can provide good scalability, but what follows is how to handle complex analytical queries. Unfortunately, NoSQL databases are not good at that.


Scalability vs SQL

Another option is to use an OLAP database such as ClickHouse. ClickHouse can handle the analytical workload very well, but it is not designed for serving online traffic. If we chose it, we would need another database for the online traffic.


OLAP vs Online Serving

What about sharding the database and then building an extract, transform, load (ETL) pipeline to synchronize the new events to a data warehouse? This sounds workable.


How a RDBMS handles the GitHub data

How a RDBMS handles the GitHub data

According to our product manager's (PM’s) plan, we needed to do some repo-specific or user-specific analysis. Although the total data volume was huge, the number of events was not too large for a single project or user. This meant using the secondary indexes in RDBMS would be a good idea. But, if we decided to use the above architecture, we had to be careful in selecting the database sharding key. For example, if we use user_id as the sharding key, then queries based on repo_id will be very tricky.

Another requirement from the PM was that our insight tool should provide OpenAPI, which meant we would have unpredictable concurrent traffic from the outside world.

Since we're not experts on Kafka and data warehouses, mastering and building such an infrastructure in just one week was a very difficult task for us.

The choice is obvious now, and don't forget PingCAP is a database company! TiDB seems a perfect fit for this, and it's a good chance to eat our own dog food. So, why not using TiDB! :)

If we use TiDB, can we get:

  • SQL support, including complex & flexible queries? ☑️
  • Scalability? ☑️
  • Secondary index support for fast lookup? ☑️
  • Capability for online serving? ☑️

Wow! It seems we got a winner!


By using the secondary index, TiDB scanned 29,639 rows (instead of 4.6 billion rows) GitHub events in 4.9 ms

By using the secondary index, TiDB scanned 29,639 rows (instead of 4.6 billion rows) GitHub events in 4.9 ms

To choose a database to support an application like OSS Insight, we think TiDB is a great choice. Plus, its simplified technology stack means a faster go-to-market and faster delivery of my boss' assignment.

After we used TiDB, we got a simplified architecture as shown below.


Simplified architecture after we use TiDB

Simplified architecture after we use TiDB

Headache 3: We have a "pushy" PM!

Just as the subtitle indicates, we have a very “pushy” PM, which is not always a bad thing. :) His demands kept extending, from the single project analysis at the very beginning to the comparison and ranking of multiple repositories, and to other multidimensional analysis such as the geographical distribution of stargazers and contributors. What’s more pressing was that the deadlines stayed unchanged!!!

We had to keep a balance between the growing demands and the tight deadlines.

To save time, we built our website using Docusaurus, an open source static site generator in React with scalability, rather than building a site from scratch. We also used Apache Echarts, a powerful charting library, to turn analytical results into good-looking and easy-to-understand charts.

We chose TiDB as the database to support our website, and it perfectly supports SQL. This way, our back-end engineers could write SQL commands to handle complex and flexible analytical queries with ease and efficiency. Then, our front-end engineers would just need to display those SQL execution results in the form of good-looking charts.

Finally, we made it. We prototyped our tool in just one week, and named it OSS Insight, short for open source software insights. We continued to fine-tune it, and it was officially released on May 3.

How we deal with analytical queries with SQL

Let's use one example to show you how we deal with complex analytical queries.

Analyze a GitHub collection: JavaScript frameworks

OSS Insight can analyze popular GitHub collections by many metrics including the number of stars, issues, and contributors. Let’s identify which JavaScript framework has the most issue creators. This is an analytical query that includes aggregation and ranking. To get the result, we only need to execute one SQL statement:

SELECT
ci.repo_name AS repo_name,
COUNT(distinct actor_login) AS num
FROM
github_events ge
JOIN collection_items ci ON ge.repo_id = ci.repo_id
JOIN collections c ON ci.collection_id = c.id
WHERE
type = 'IssuesEvent'
AND action = 'opened'
AND c.id = 10005
-- Exclude Bots
and actor_login not like '%bot%'
and actor_login not in (select login from blacklist_users)
GROUP BY 1
ORDER BY 2 DESC
;

In the statement above, the collections and collection_items tables store the data of all GitHub repository collections in various areas. Each table has 30 rows. To get the order of issue creators, we need to associate the repository ID in the collection_items table with the real, 4.6-billion-row github_events table as shown below.


mysql> select * from collection_items where collection_id = 10005;
+-----+---------------+-----------------------+-----------+
| id | collection_id | repo_name | repo_id |
+-----+---------------+-----------------------+-----------+
| 127 | 10005 | marko-js/marko | 15720445 |
| 129 | 10005 | angular/angular | 24195339 |
| 131 | 10005 | emberjs/ember.js | 1801829 |
| 135 | 10005 | vuejs/vue | 11730342 |
| 136 | 10005 | vuejs/core | 137078487 |
| 138 | 10005 | facebook/react | 10270250 |
| 142 | 10005 | jashkenas/backbone | 952189 |
| 143 | 10005 | dojo/dojo | 10160528 |
...
30 rows in set (0.05 sec)

Next, let's look at the execution plan. TiDB is compatible with MySQL syntax, so its execution plan looks very similar to that of MySQL.

In the figure below, notice the parts in red boxes. The data in the table collection_items is read through distributed[row], which means this data is processed by TiDB’s row storage engine, TiKV. The data in the table github_events is read through distributed[column], which means this data is processed by TiDB’s columnar storage engine, TiFlash. TiDB uses both row and columnar storage engines to execute the same SQL statement. This is so convenient for OSS Insight because it doesn’t have to split the query into two statements.


TiDB execution plan

TiDB execution plan

TiDB returns the following result:

+-----------------------+-------+
| repo_name | num |
+-----------------------+-------+
| angular/angular | 11597 |
| facebook/react | 7653 |
| vuejs/vue | 6033 |
| angular/angular.js | 5624 |
| emberjs/ember.js | 2489 |
| sveltejs/svelte | 1978 |
| vuejs/core | 1792 |
| Polymer/polymer | 1785 |
| jquery/jquery | 1587 |
| jashkenas/backbone | 1463 |
| ionic-team/stencil | 1101 |
...
30 rows in set
Time: 7.809s

Then, we just need to draw the result with Apache Echarts into a more visualized chart as shown below.


JavaScript frameworks with the most issue creators

JavaScript frameworks with the most issue creators

Note: You can click the REQUEST INFO on the upper right side of each chart to get the SQL command for each result.

Feedback: People love it!

After we released OSS Insight on May 3, we have received loud applause on social media, via emails and private messages, from many developers, engineers, researchers, and people who are passionate about the open source community in various companies and industries.

I am more than excited and grateful that so many people find OSS Insight interesting, helpful, and valuable. I am also proud that my team made such a wonderful product in such a short time.


Applause given by developers and organizations on Twitter-1

Applause given by developers and organizations on Twitter-1

Applause given by developers and organizations on Twitter

Lessons learned

Looking back at the process we used to build this website, we have learned many mind-refreshing lessons.

First, quick doesn’t mean dirty, as long as we make the right choices. Building an insight tool in just one week is tricky, but thanks to those wonderful, ready-made, and open source projects such as TiDB, Docusaurus, and Echarts, we made it happen with efficiency and without compromising the quality.

Second, it’s crucial to select the right database—especially one that supports SQL. TiDB is a distributed SQL database with great scalability that can handle both transactional and real-time analytical workloads. With its help, we can process billions of rows of data with ease, and use SQL commands to execute complicated real-time queries. Further, using TiDB means we can leverage its resources to go to market faster and get feedback promptly.

If you like our project or are interested in joining us, you’re welcome to submit your PRs to our GitHub repository. You can also follow us on Twitter for the latest information.

note

📌 Join our workshop

If you want to get your own insights, you can join our workshop and try using TiDB to support your own datasets.

· 7 min read
Mini256

When it comes to GitHub, we often see fake GitHub users who are always enthusiastic and active, giving timely feedback to project maintainers and contributors, and helping developers with tasks that can be automated. Yes, the next thing I want to discuss is something about GitHub bots.

Overview

In the OSSInsight project, we have developed a number of metrics to provide insight into open source projects. When developing some open source project metrics, we always consider excluding bot-generated actions or events from the metric calculation.

However, We can't ignore the contribution of robots in the domain of open source, and it's important to shift our thinking to look at what bots are doing on GitHub.

GitHub's bots help developers do a lot of work:

  • Issue triage and management. (For example: stale[bot]todo[bot])
  • Code review, security audit and quality inspection (For example, snyk-bot).
  • Format checking like ensuring license agreement signing, or make sure commit messages semantic. (For example: CLAassistant)
  • Integration with third-party systems, including Jira, Slack, Jenkins and so on.
  • As an agent to help contributor perform some operations needed permission on the repository. (For example: k8s-ci-botti-chi-bot)

Looking at the historical data, we see that the number of GitHub bots grows significantly faster after 2019 (on average, 20,000 new bots are created each year)

· 3 min read
Jagger

In this chapter, we will share with you some of the top JavaScript Framework repos(JSF repos) on GitHub in 2021 measured by different metrics including the number of stars, PRs, contributors, countries, regions and so on.

Note:

  1. You can move your cursor onto any of the repository bars/lines on the chart and get the exact number.
  2. The SQL commands above each chart are what we use on our TiDB Cloud to get the analytical results. Try those SQL commands by yourselves on TiDB Cloud with this 10-minute tutorial.

Star history of top JavaScript Framework repos since 2011

The number of stars is often thought of as a measure of whether a GitHub repository is popular or not. We sort all JavaScript framework repositories from GitHub by the total number of historical stars since 2011. For visualizing the results more intuitively, we show the top 10 open source databases by using an interactive line chart.